 1
1peptide
spectra
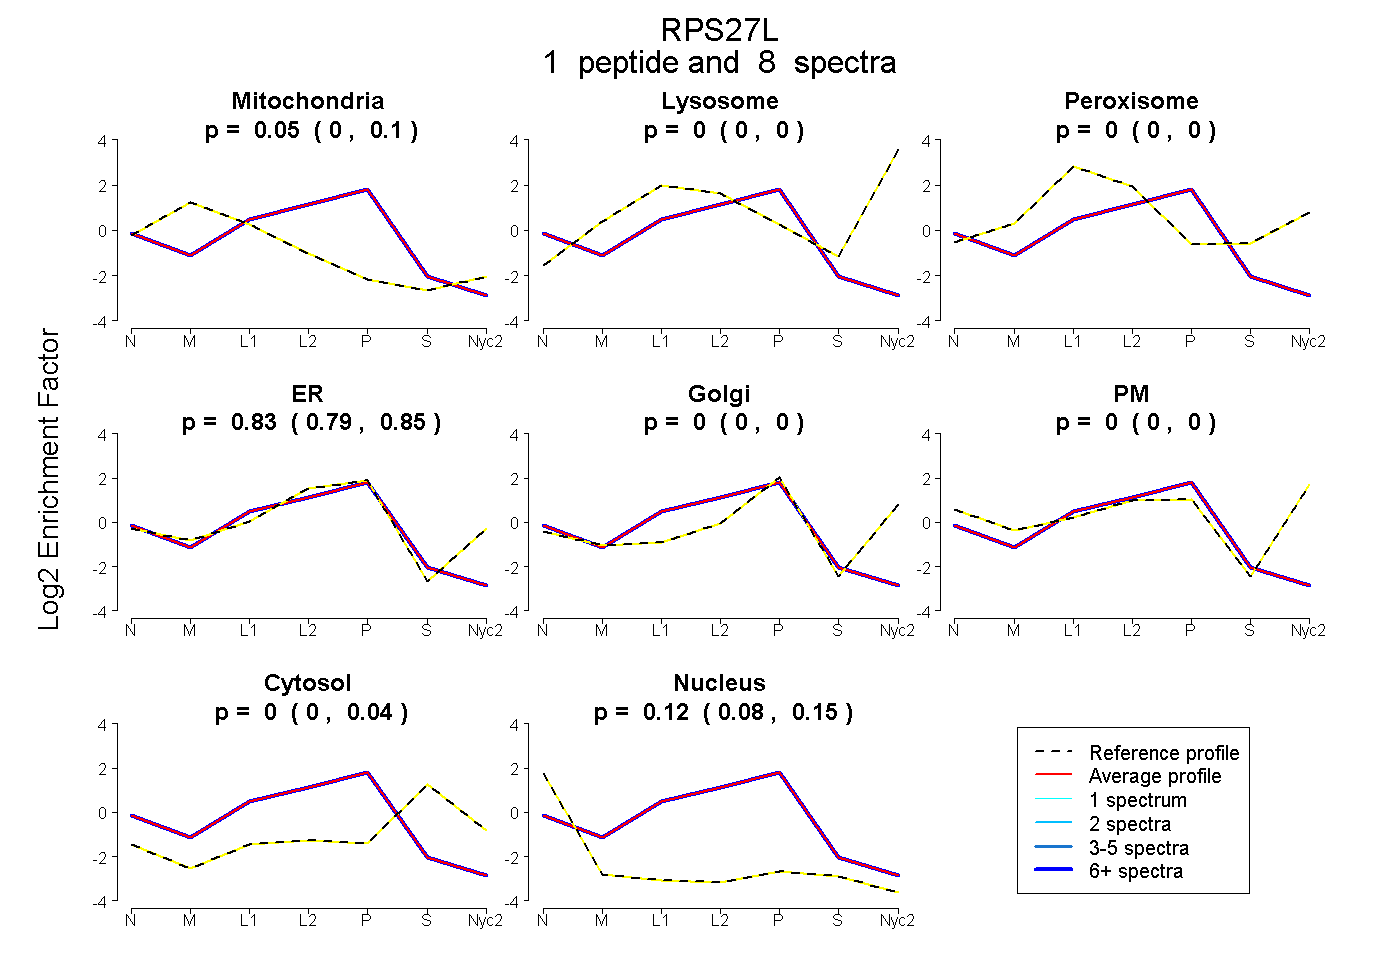
0.000 | 0.096
0.000 | 0.000
0.000 | 0.000
0.792 | 0.848
0.000 | 0.000
0.000 | 0.000
0.000 | 0.042
0.082 | 0.151
1peptide
spectra
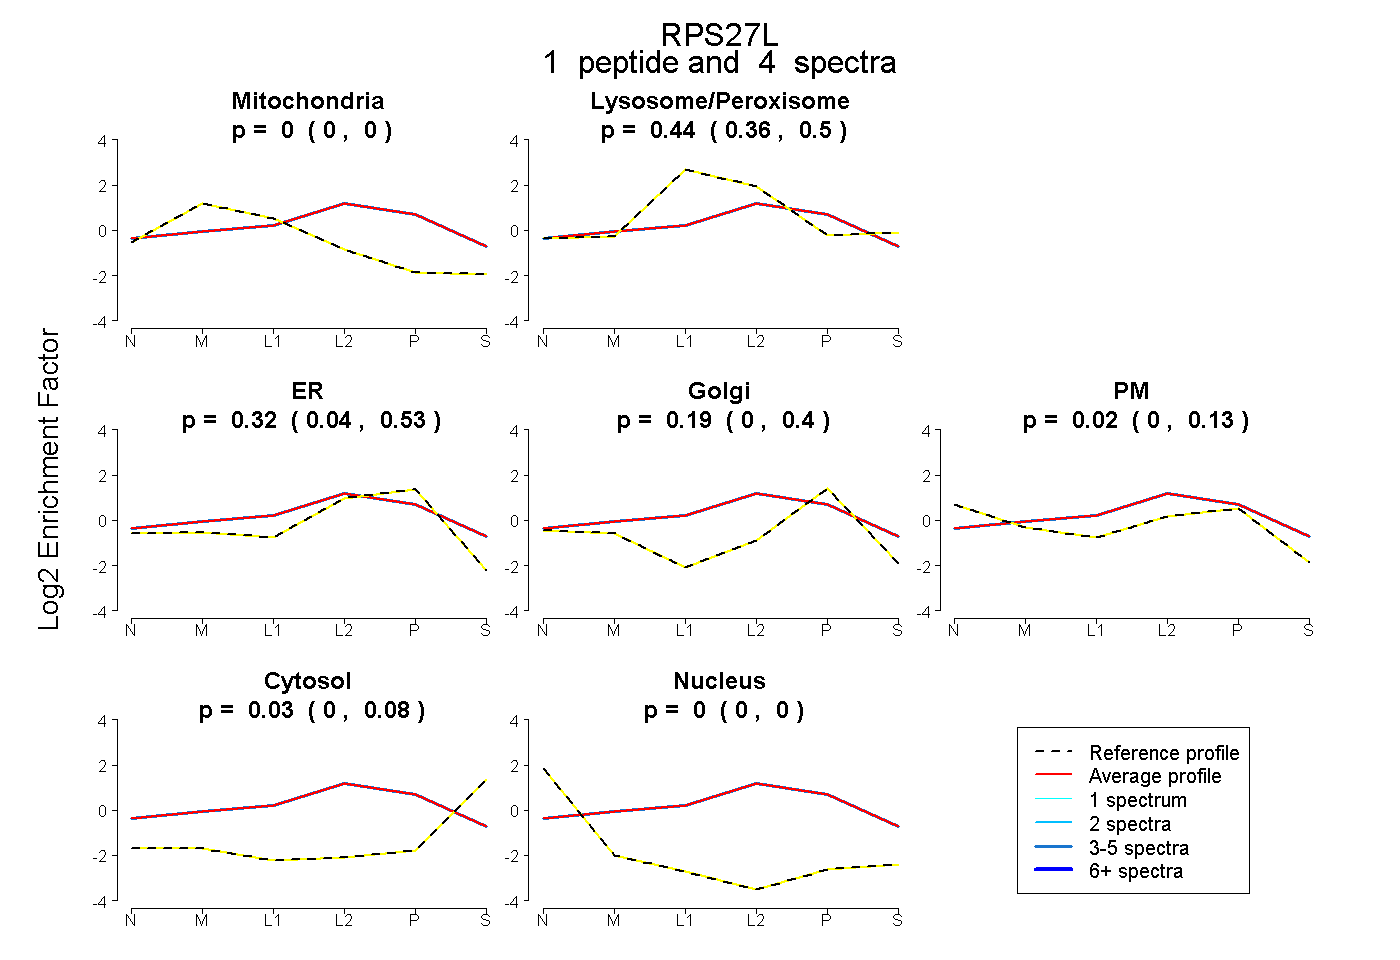
0.000 | 0.000
0.362 | 0.502
0.039 | 0.534
0.000 | 0.397
0.000 | 0.125
0.000 | 0.081
0.000 | 0.000
1peptide
spectra
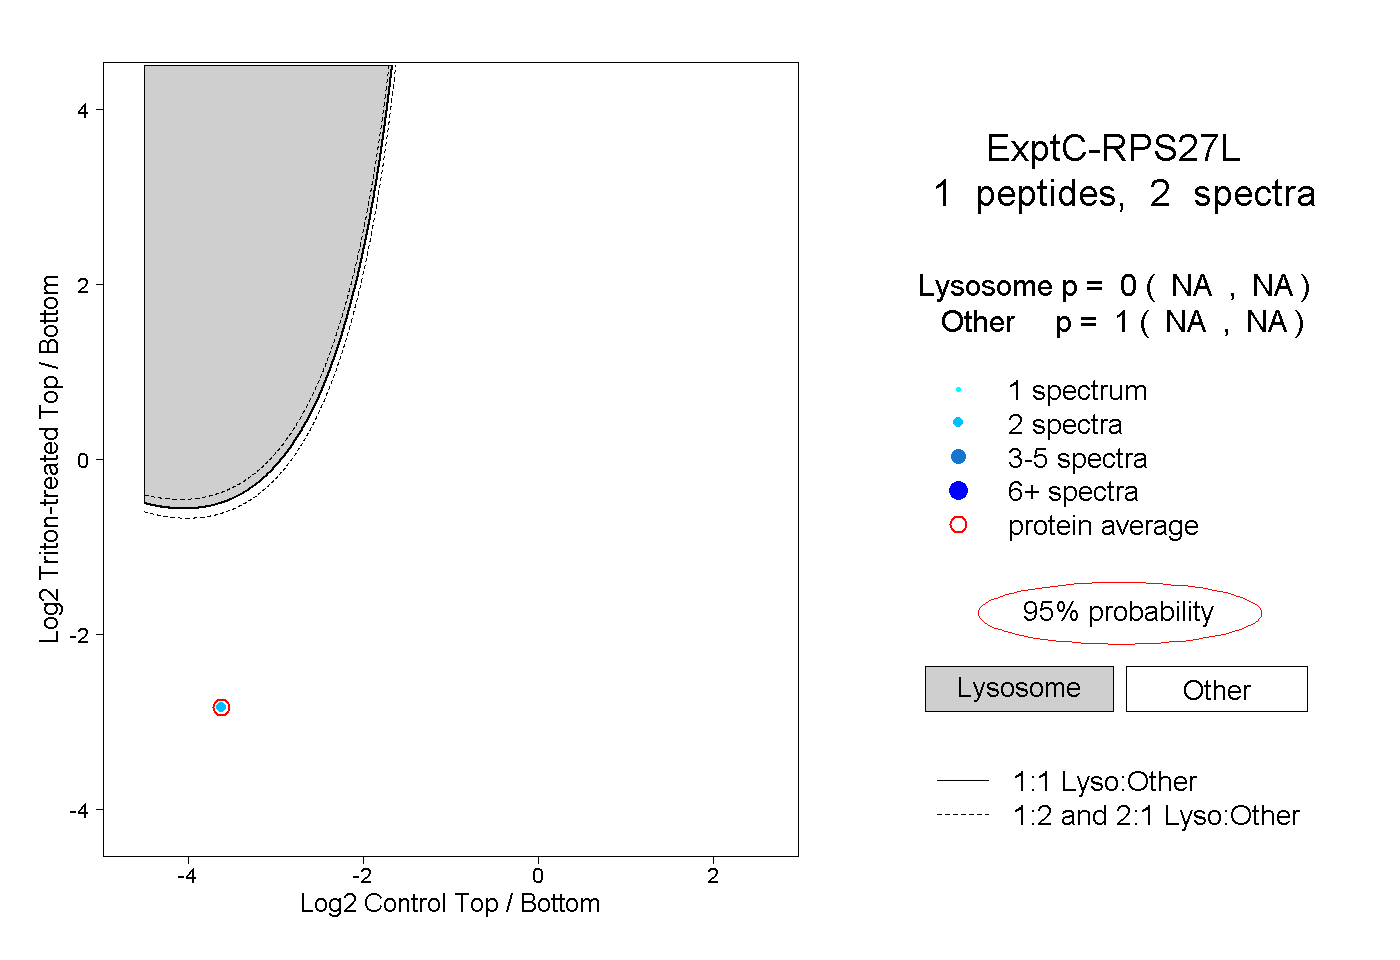
NA | NA
NA | NA