 3
3peptides
spectra
0.000 | 0.000
0.000 | 0.000
0.000 | 0.043
0.000 | 0.194
0.174 | 0.439
0.000 | 0.091
0.529 | 0.584
0.000 | 0.043
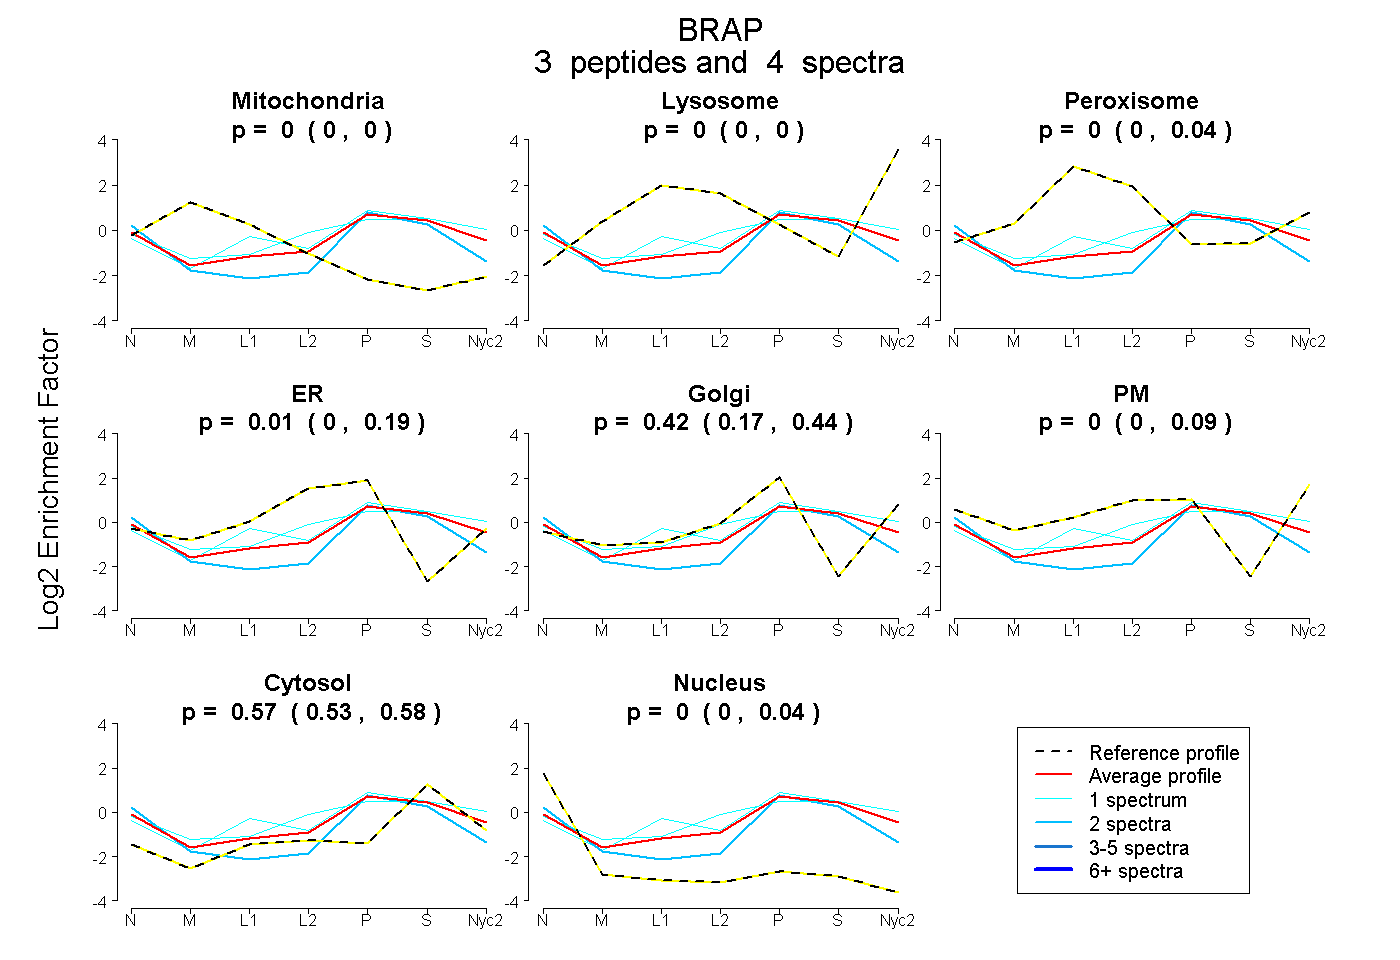
| Plot | Mito | Lyso | Perox | ER | Golgi | PM | Cytosol | Nucleus | |||||
| Expt A |
3 peptides |
4 spectra |
|
0.000 0.000 | 0.000 |
0.000 0.000 | 0.000 |
0.000 0.000 | 0.043 |
0.009 0.000 | 0.194 |
0.423 0.174 | 0.439 |
0.000 0.000 | 0.091 |
0.568 0.529 | 0.584 |
0.000 0.000 | 0.043 |
| 1 spectrum, FVAPFNDVIEQMK | 0.000 | 0.000 | 0.125 | 0.000 | 0.380 | 0.000 | 0.495 | 0.000 | ||
| 1 spectrum, YCQTPEPVEENK | 0.000 | 0.000 | 0.000 | 0.079 | 0.076 | 0.292 | 0.554 | 0.000 | ||
| 2 spectra, TSSAAPSSAQR | 0.000 | 0.000 | 0.000 | 0.000 | 0.326 | 0.000 | 0.480 | 0.193 |