10
10peptides
spectra
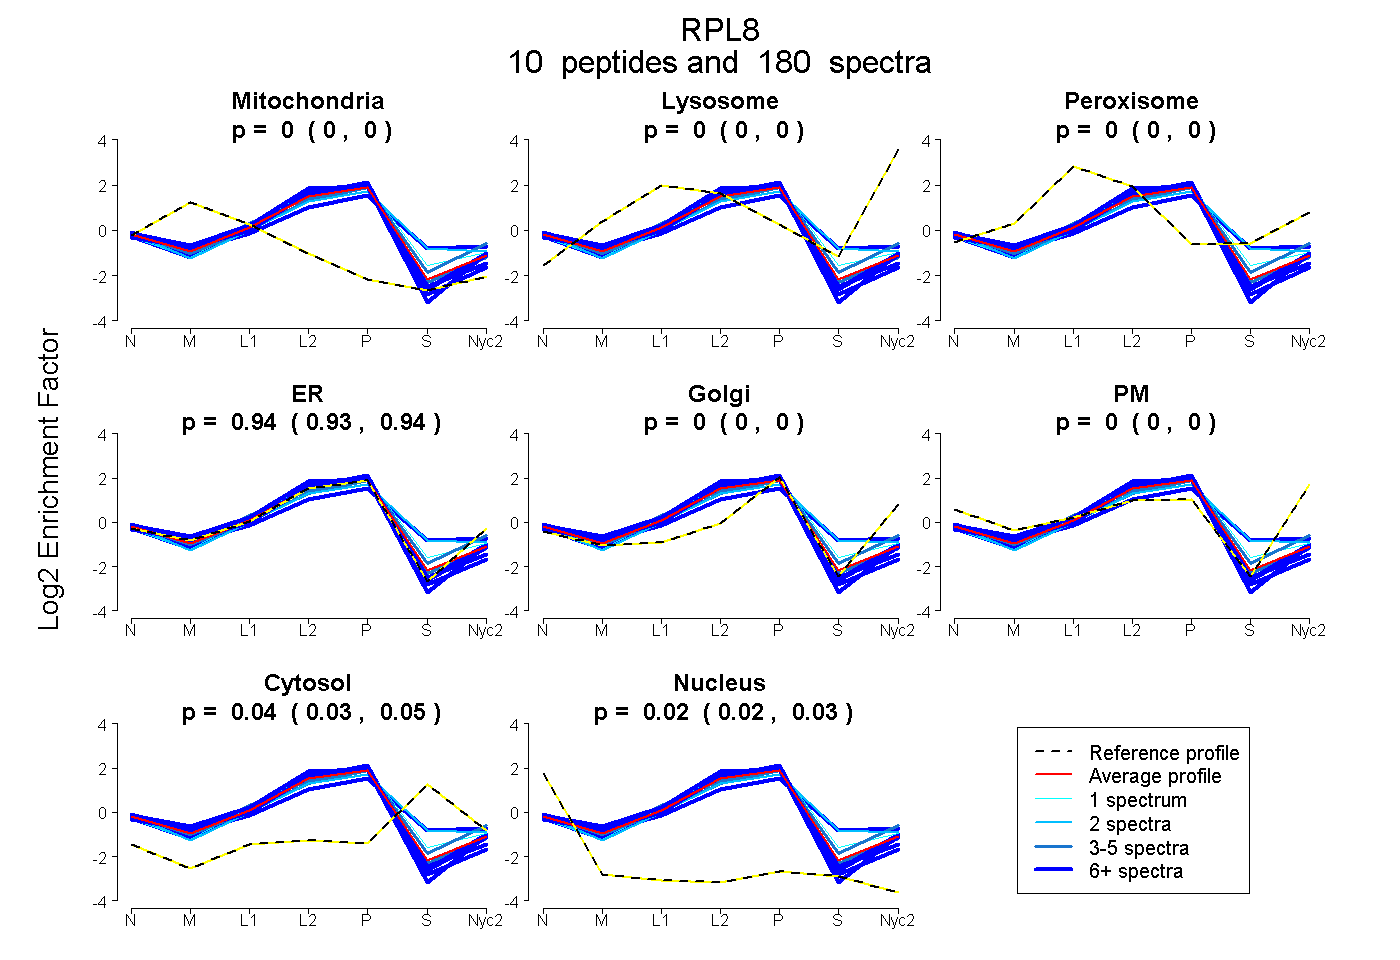
0.000 | 0.000
0.000 | 0.000
0.000 | 0.000
0.932 | 0.938
0.000 | 0.000
0.000 | 0.000
0.035 | 0.046
0.020 | 0.027
10peptides
spectra
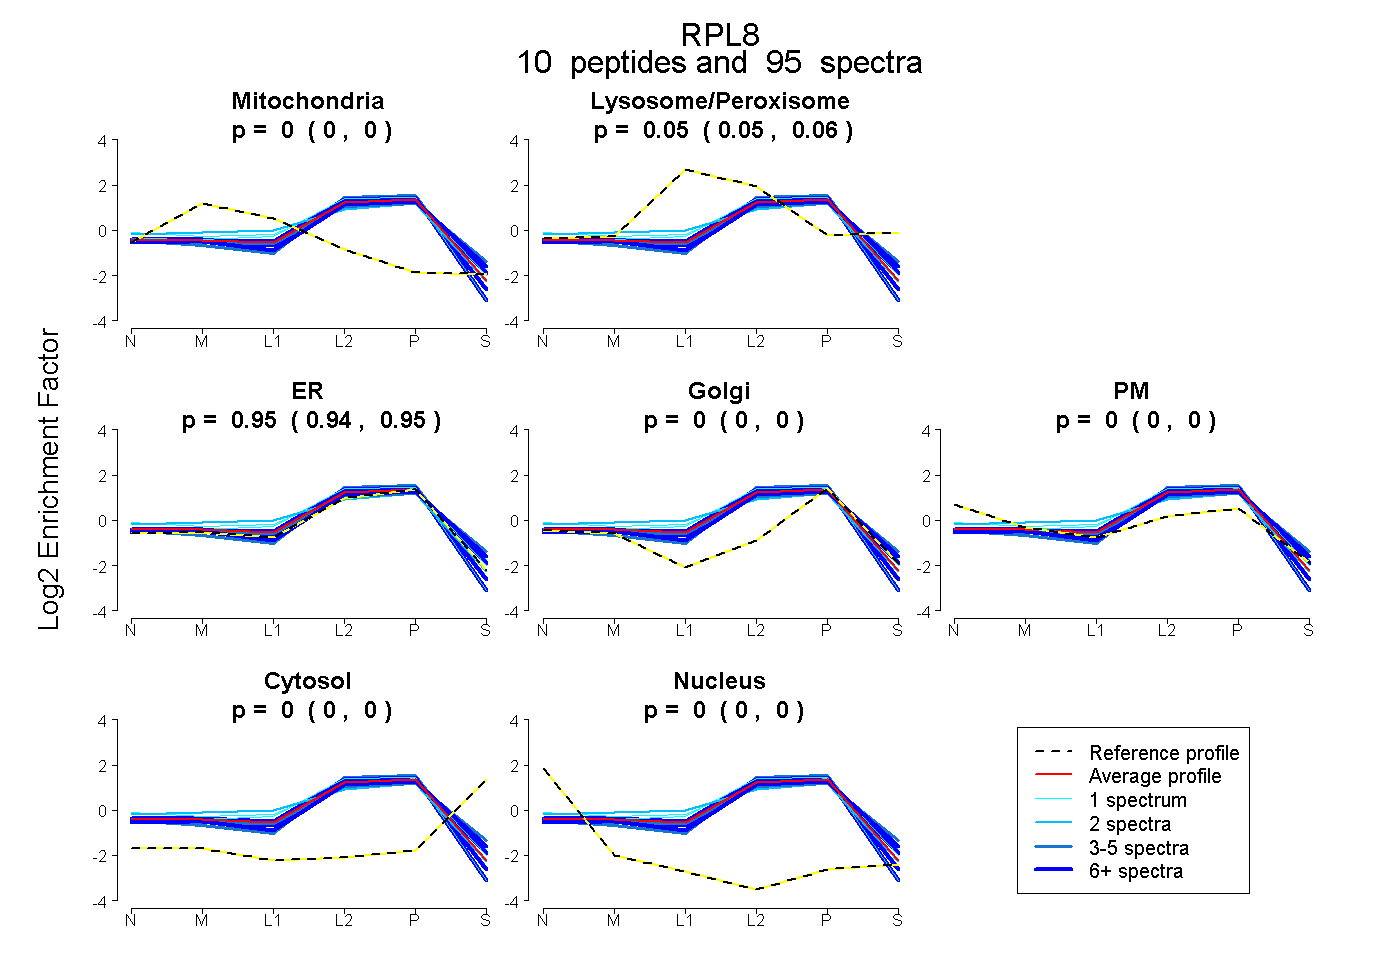
0.000 | 0.000
0.047 | 0.057
0.939 | 0.952
0.000 | 0.000
0.000 | 0.004
0.000 | 0.000
0.000 | 0.000