 10
10peptides
spectra
0.000 | 0.000
0.000 | 0.000
0.000 | 0.000
0.932 | 0.938
0.000 | 0.000
0.000 | 0.000
0.035 | 0.046
0.020 | 0.027
| Plot | Mito | Lyso | Perox | ER | Golgi | PM | Cytosol | Nucleus | |||||
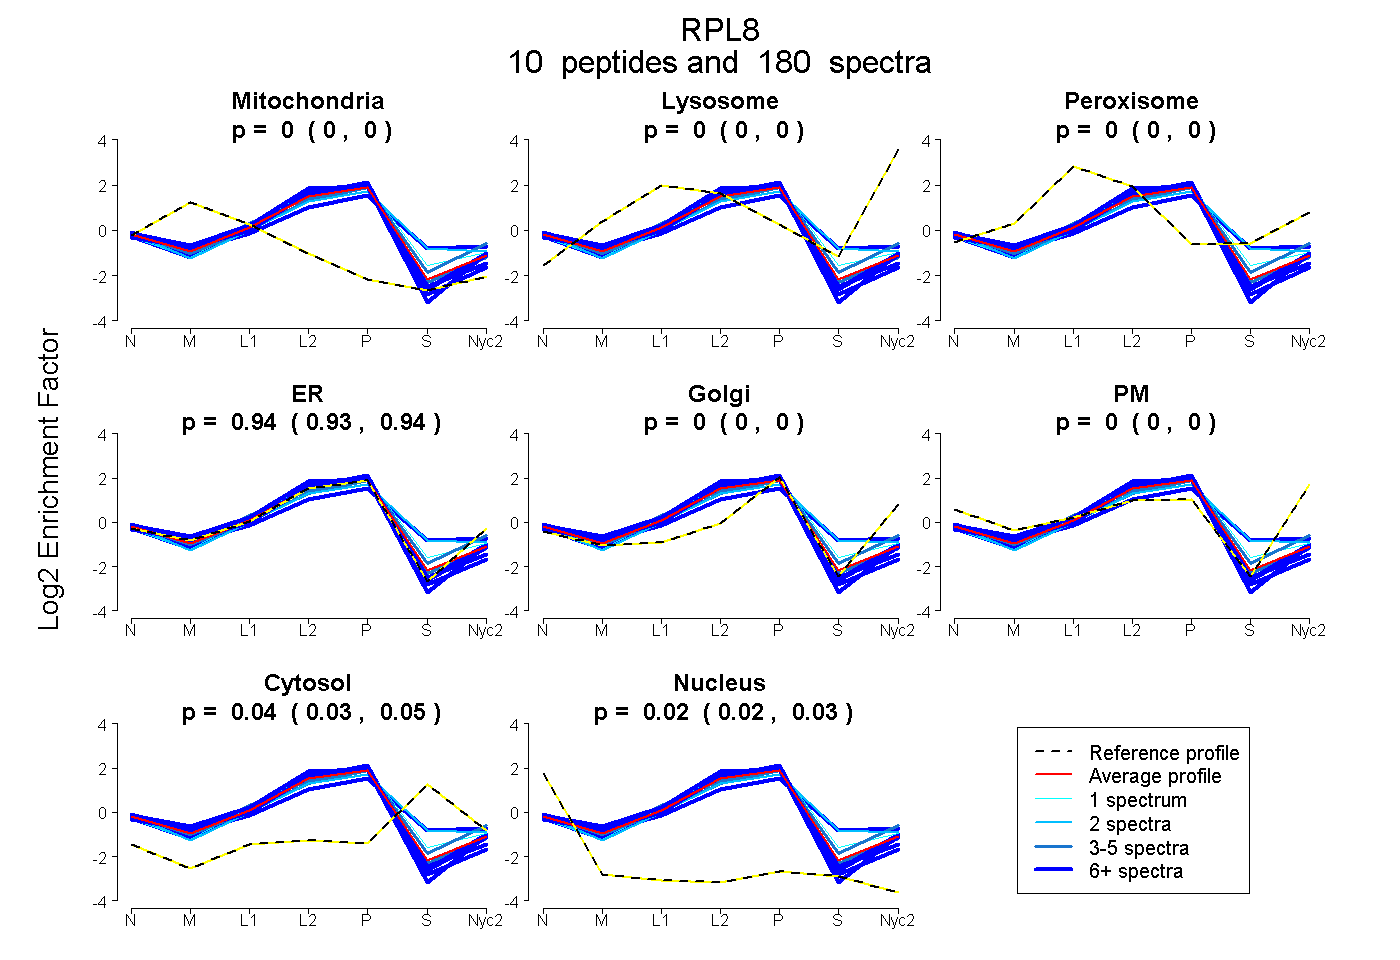
| Expt A |
10 peptides |
180 spectra |
|
0.000 0.000 | 0.000 |
0.000 0.000 | 0.000 |
0.000 0.000 | 0.000 |
0.935 0.932 | 0.938 |
0.000 0.000 | 0.000 |
0.000 0.000 | 0.000 |
0.041 0.035 | 0.046 |
0.024 0.020 | 0.027 |
| 46 spectra, AVVGVVAGGGR | 0.000 | 0.000 | 0.000 | 0.940 | 0.000 | 0.000 | 0.000 | 0.060 | ||
| 4 spectra, ASGNYATVISHNPETK | 0.000 | 0.000 | 0.000 | 0.949 | 0.000 | 0.000 | 0.024 | 0.028 | ||
| 4 spectra, LPSGSK | 0.000 | 0.000 | 0.000 | 0.897 | 0.000 | 0.000 | 0.103 | 0.000 | ||
| 23 spectra, GAGSVFR | 0.000 | 0.000 | 0.000 | 0.975 | 0.000 | 0.000 | 0.000 | 0.025 | ||
| 25 spectra, DIIHDPGR | 0.000 | 0.000 | 0.066 | 0.695 | 0.000 | 0.000 | 0.239 | 0.000 | ||
| 36 spectra, VISSANR | 0.026 | 0.000 | 0.000 | 0.974 | 0.000 | 0.000 | 0.000 | 0.000 | ||
| 2 spectra, SAPLAK | 0.000 | 0.000 | 0.039 | 0.732 | 0.000 | 0.000 | 0.228 | 0.000 | ||
| 20 spectra, VGLIAAR | 0.016 | 0.000 | 0.000 | 0.942 | 0.000 | 0.000 | 0.000 | 0.041 | ||
| 19 spectra, AVDFAER | 0.001 | 0.000 | 0.000 | 0.971 | 0.000 | 0.000 | 0.000 | 0.027 | ||
| 1 spectrum, IDKPILK | 0.000 | 0.000 | 0.021 | 0.874 | 0.000 | 0.000 | 0.105 | 0.000 |
| Plot | Mito | Lyso or Perox | ER | Golgi | PM | Cytosol | Nucleus | ||||||
| Expt B |
10 peptides |
95 spectra |
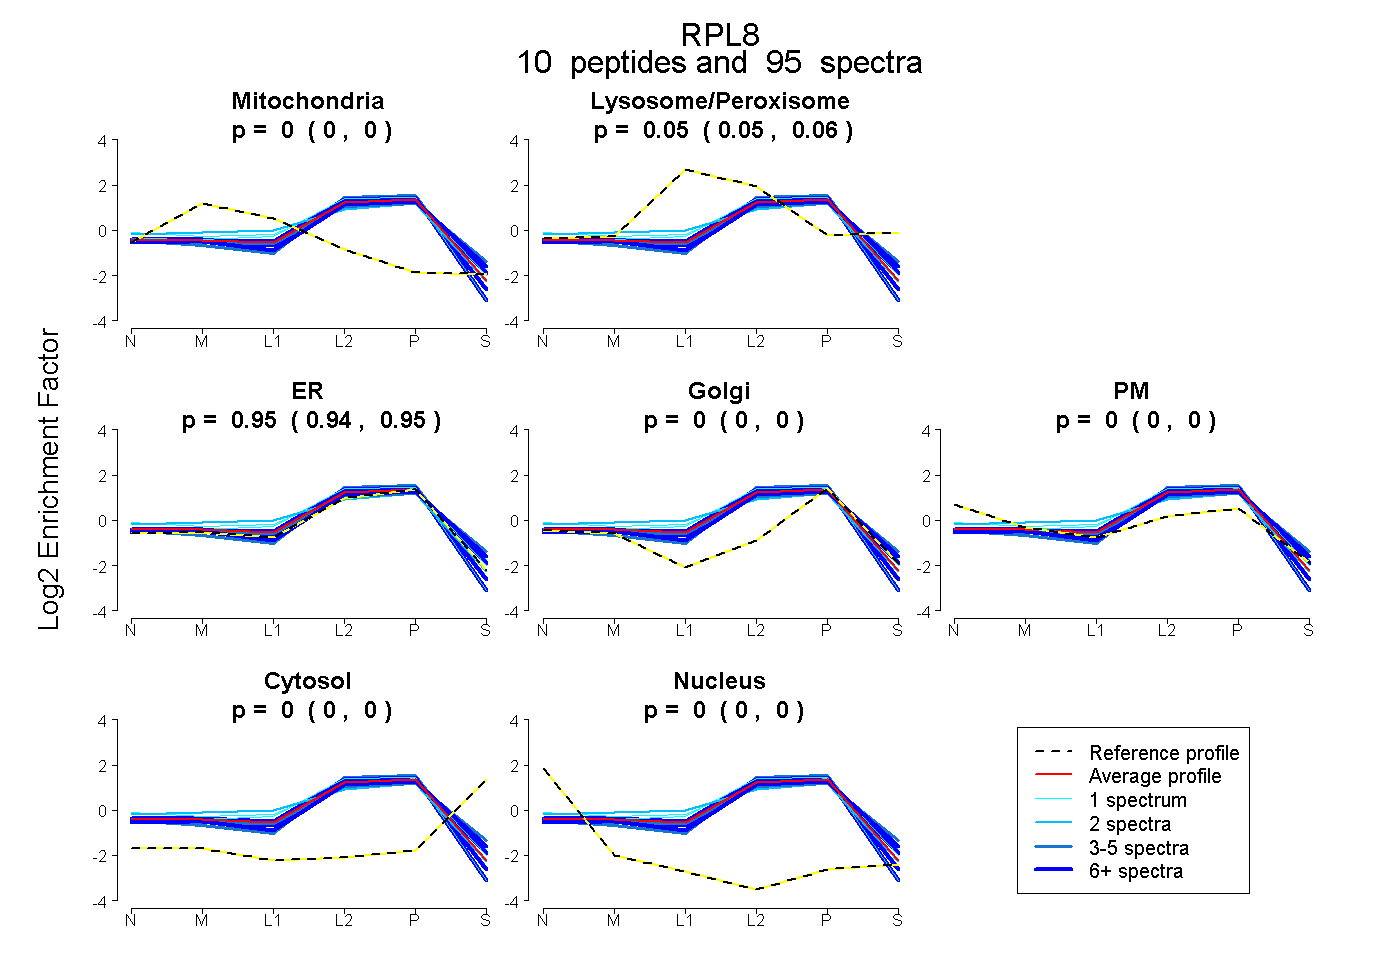 |
0.000 0.000 | 0.000 |
0.052 0.047 | 0.057 |
0.948 0.939 | 0.952 |
0.000 0.000 | 0.000 |
0.000 0.000 | 0.004 |
0.000 0.000 | 0.000 |
0.000 0.000 | 0.000 |
|||
| Plot | Lyso | Other | |||||||||||
| Expt C |
12 peptides |
347 spectra |
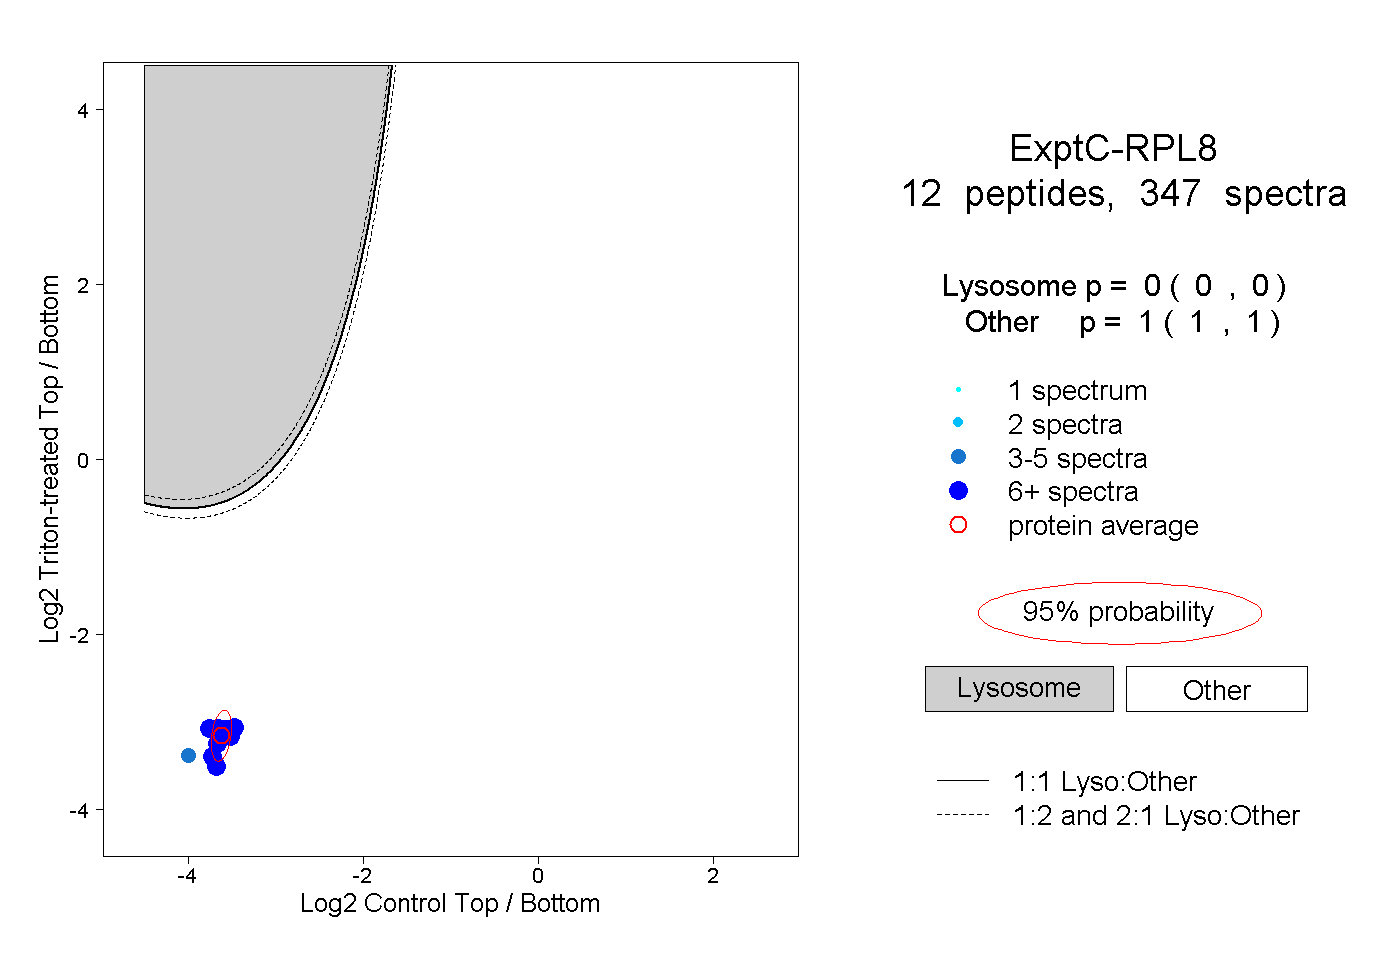 |
0.000 0.000 | 0.000 |
1.000 1.000 | 1.000 |
||||||||
| Plot | Lyso | Other | |||||||||||
| Expt D |
7 peptides |
48 spectra |
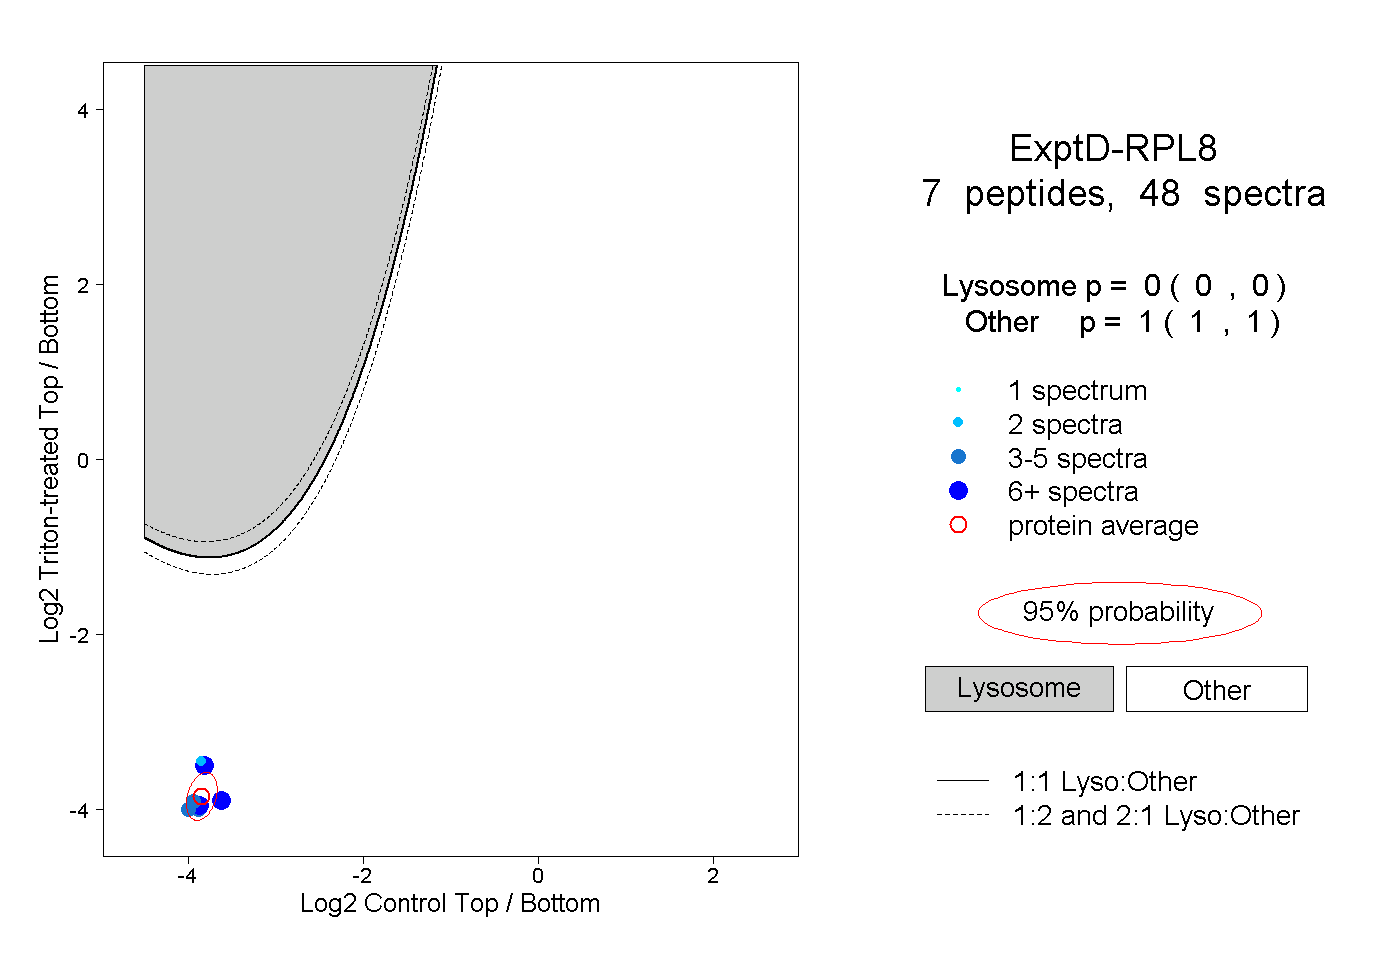 |
0.000 0.000 | 0.000 |
1.000 1.000 | 1.000 |