 1
1peptide
spectra
0.000 | 0.000
0.268 | 0.455
0.000 | 0.043
0.000 | 0.000
0.000 | 0.000
0.220 | 0.375
0.150 | 0.306
0.022 | 0.128
1peptide
spectra
0.000 | 0.000
1.000 | 1.000
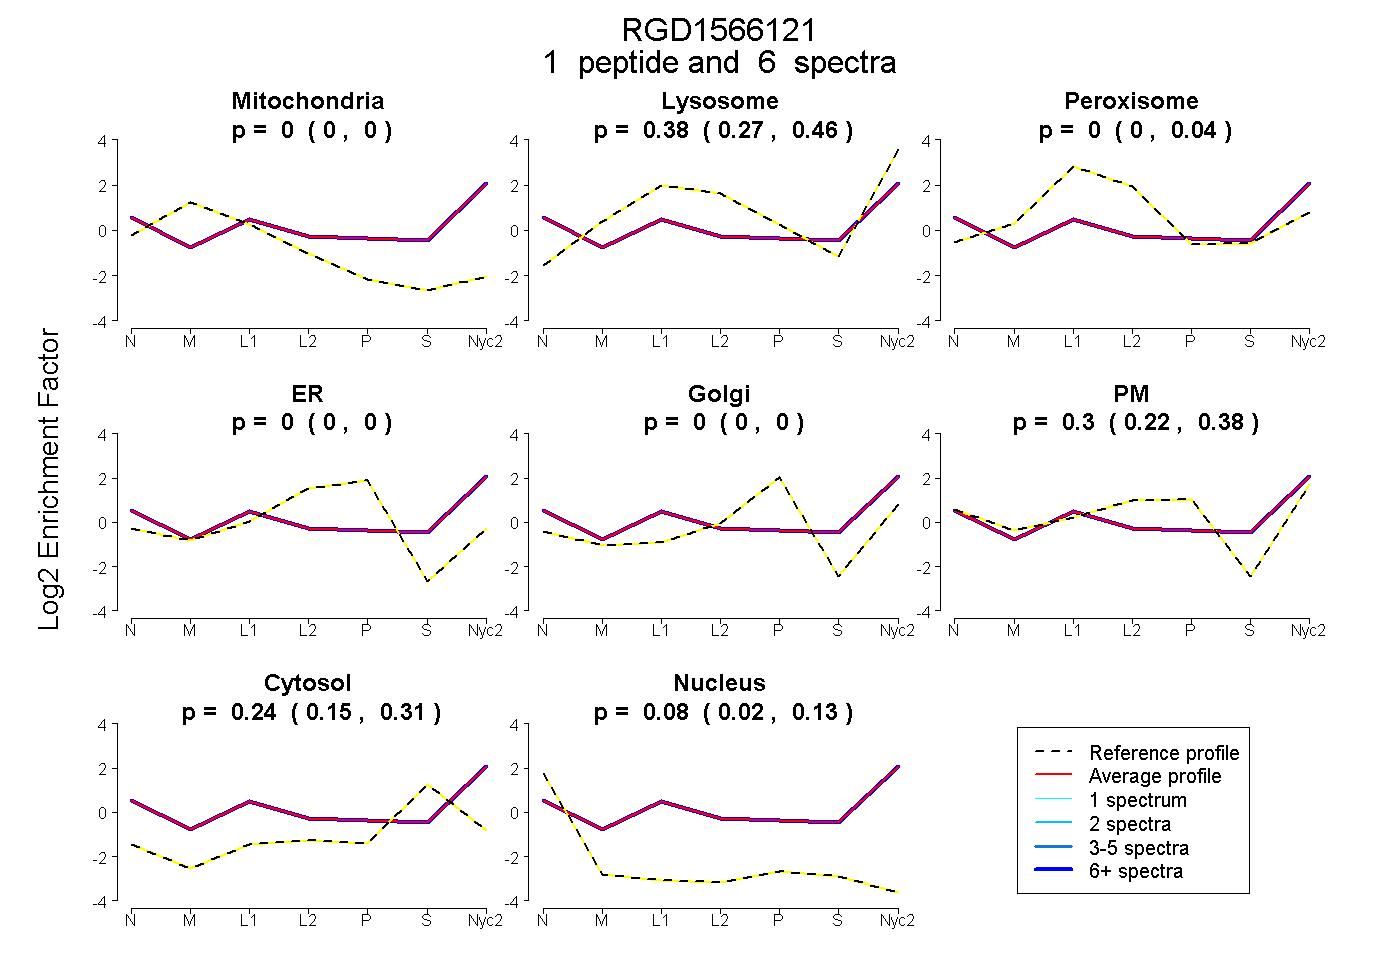
| Plot | Mito | Lyso | Perox | ER | Golgi | PM | Cytosol | Nucleus | |||||
| Expt A |
1 peptide |
6 spectra |
|
0.000 0.000 | 0.000 |
0.379 0.268 | 0.455 |
0.000 0.000 | 0.043 |
0.000 0.000 | 0.000 |
0.000 0.000 | 0.000 |
0.303 0.220 | 0.375 |
0.236 0.150 | 0.306 |
0.082 0.022 | 0.128 |
||
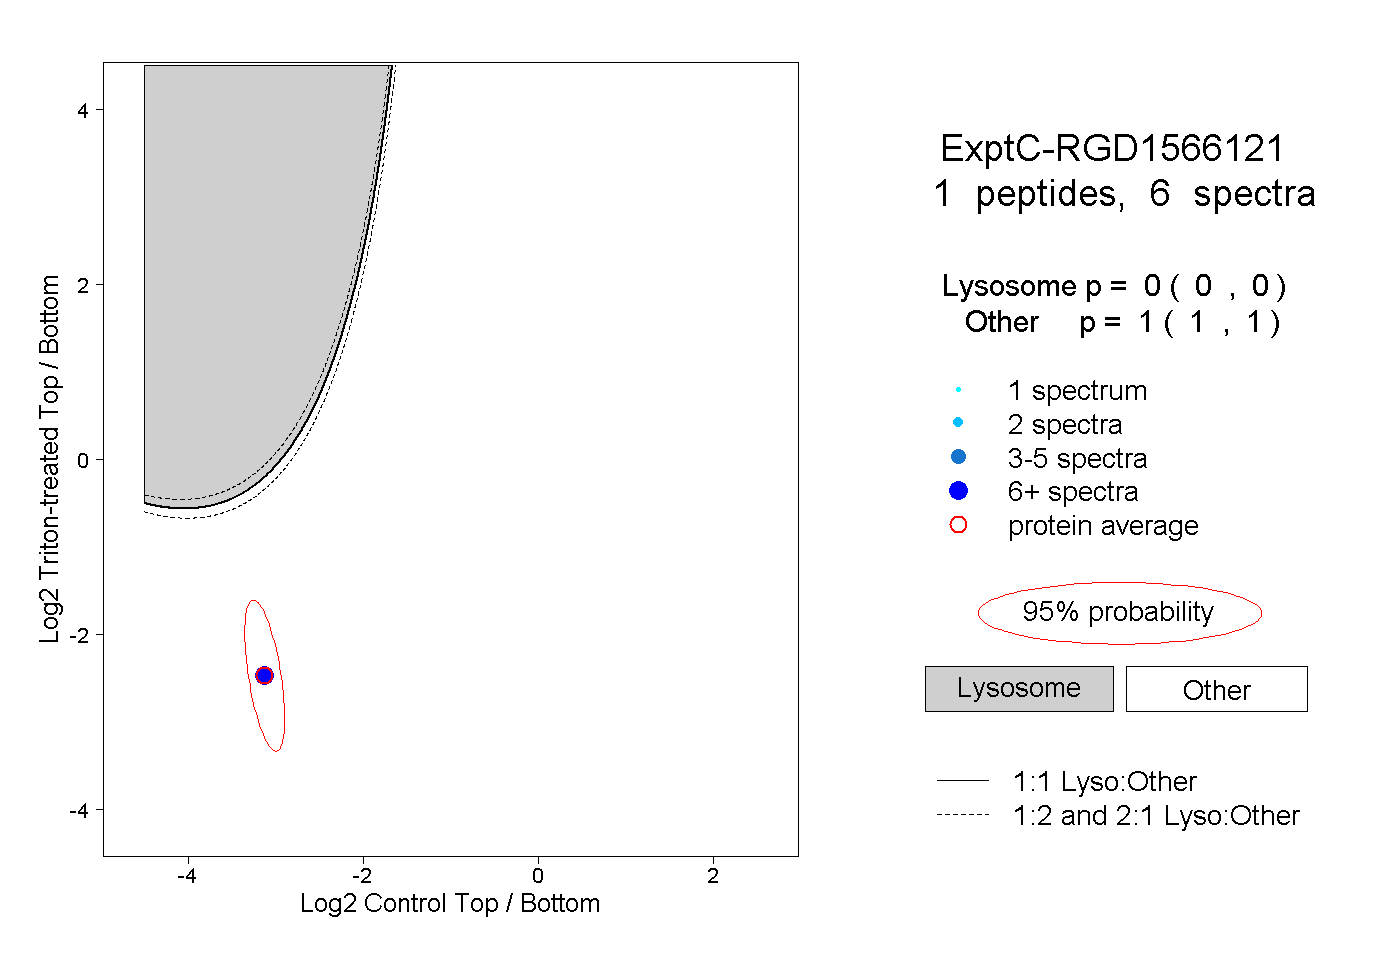
| Plot | Lyso | Other | |||||||||||
| Expt C |
1 peptide |
6 spectra |
|
0.000 0.000 | 0.000 |
1.000 1.000 | 1.000 |