 5
5peptides
spectra
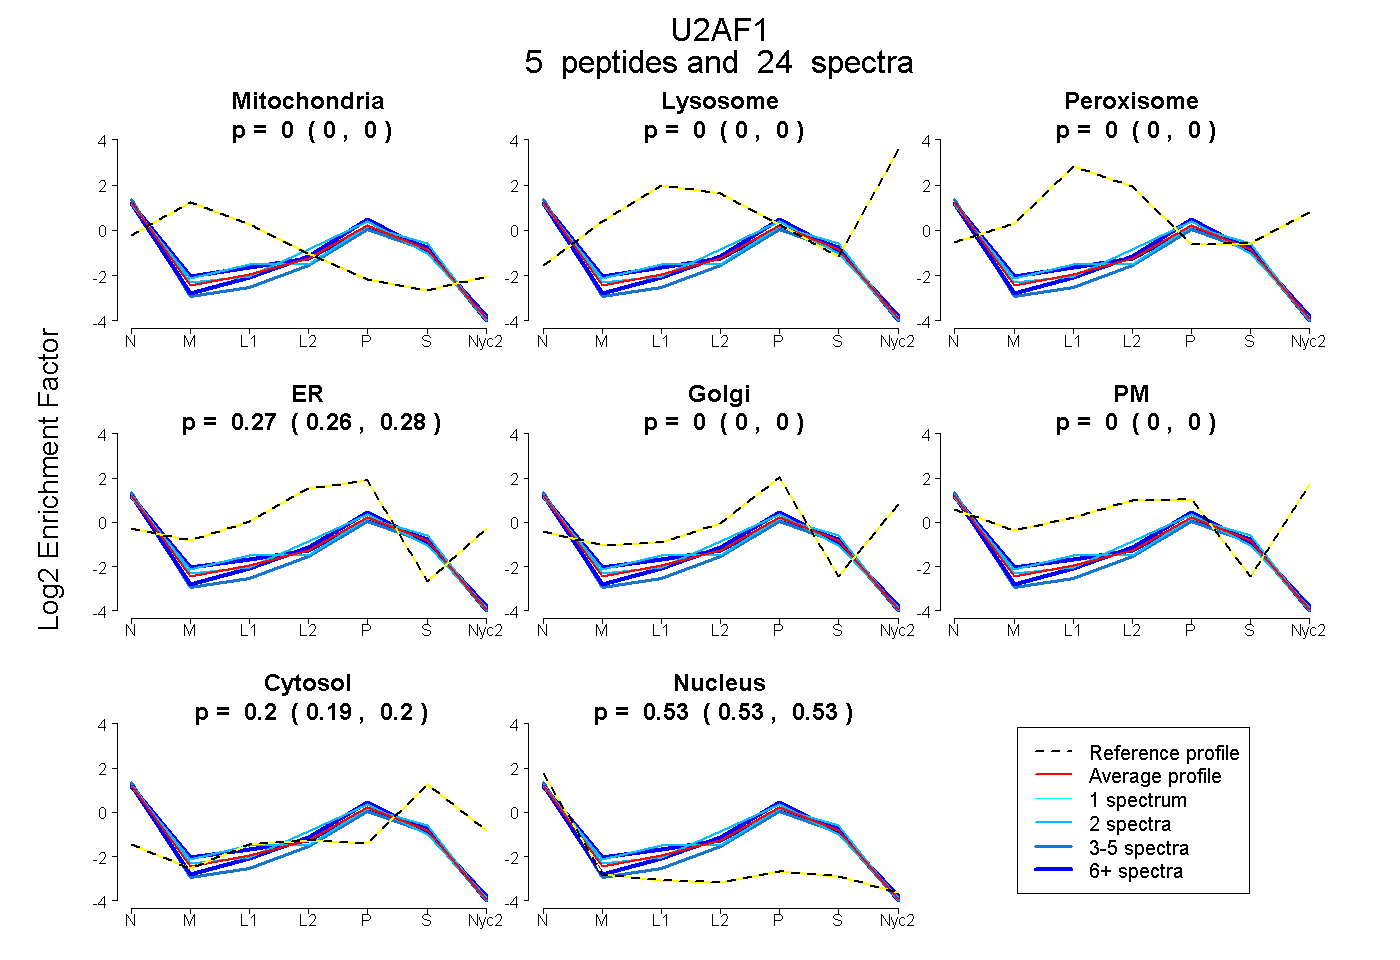
0.000 | 0.000
0.000 | 0.000
0.000 | 0.000
0.264 | 0.276
0.000 | 0.000
0.000 | 0.000
0.193 | 0.203
0.526 | 0.535
2peptides
spectra

0.000 | 0.000
0.000 | 0.073
0.000 | 0.000
0.000 | 0.000
0.449 | 0.583
0.058 | 0.189
0.259 | 0.363
5peptides
spectra
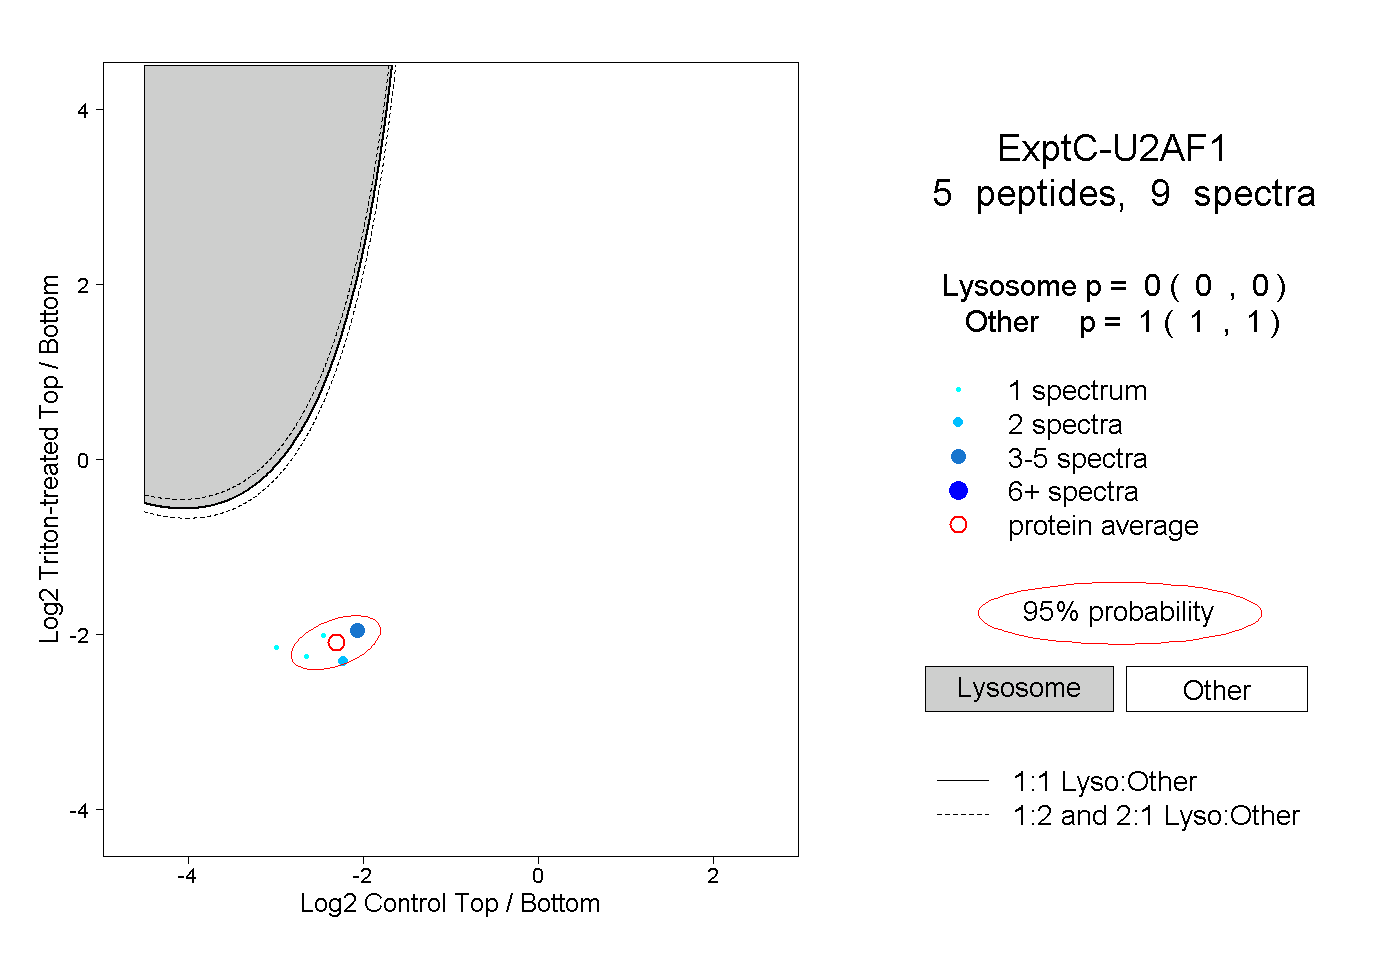
0.000 | 0.000
1.000 | 1.000