 1
1peptide
spectra
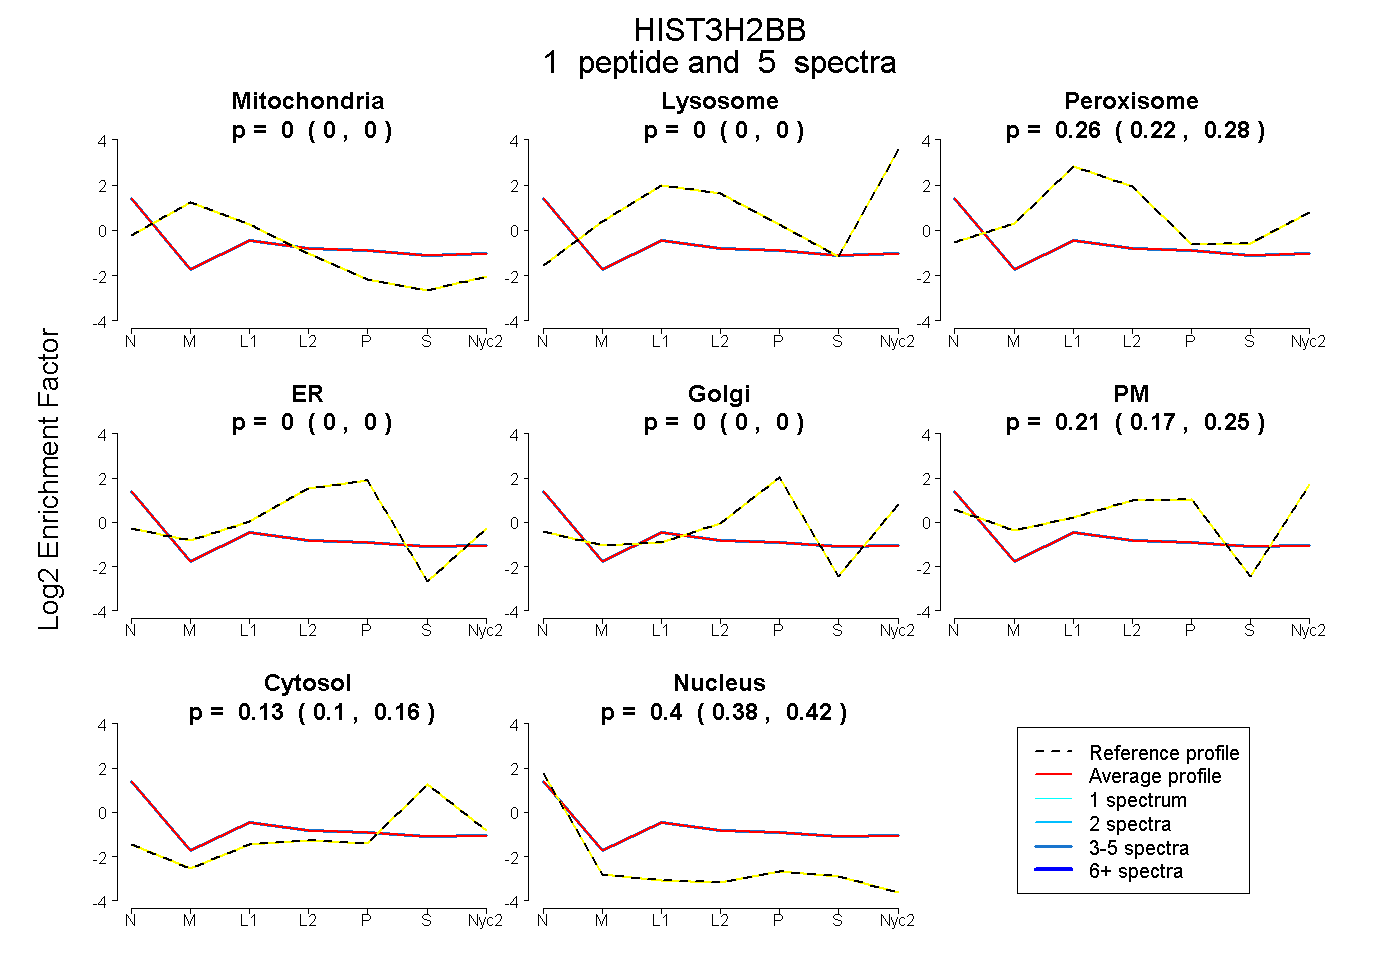
0.000 | 0.000
0.000 | 0.000
0.221 | 0.282
0.000 | 0.000
0.000 | 0.000
0.172 | 0.245
0.102 | 0.155
0.380 | 0.422
1peptide
spectrum
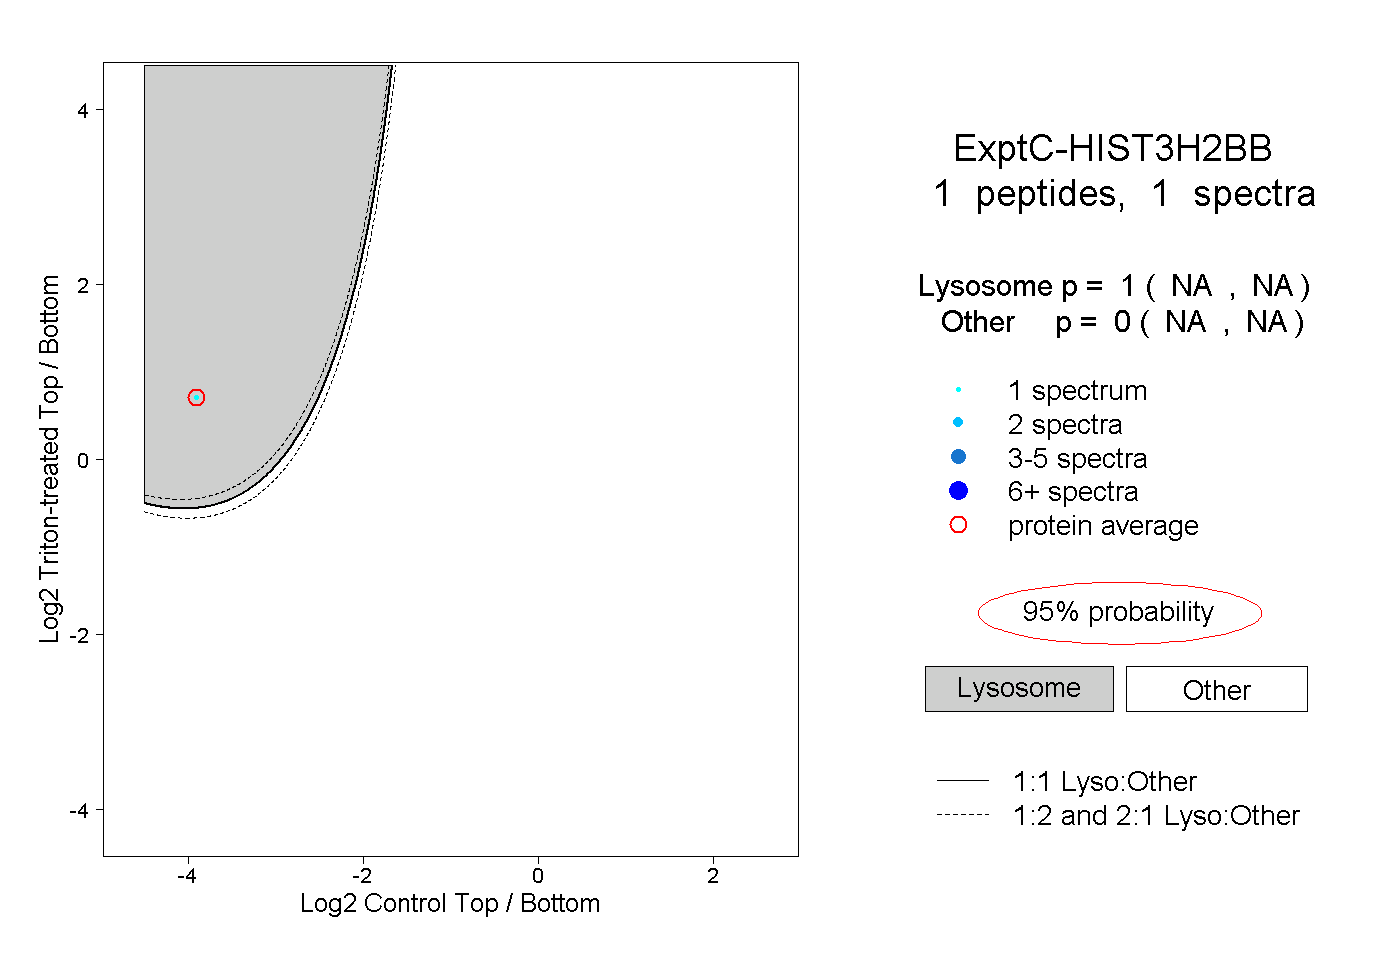
NA | NA
NA | NA
| Plot | Mito | Lyso | Perox | ER | Golgi | PM | Cytosol | Nucleus | |||||
| Expt A |
1 peptide |
5 spectra |
|
0.000 0.000 | 0.000 |
0.000 0.000 | 0.000 |
0.256 0.221 | 0.282 |
0.000 0.000 | 0.000 |
0.000 0.000 | 0.000 |
0.209 0.172 | 0.245 |
0.131 0.102 | 0.155 |
0.404 0.380 | 0.422 |
||
| Plot | Lyso | Other | |||||||||||
| Expt C |
1 peptide |
1 spectrum |
|
1.000 NA | NA |
0.000 NA | NA |