11
11peptides
spectra
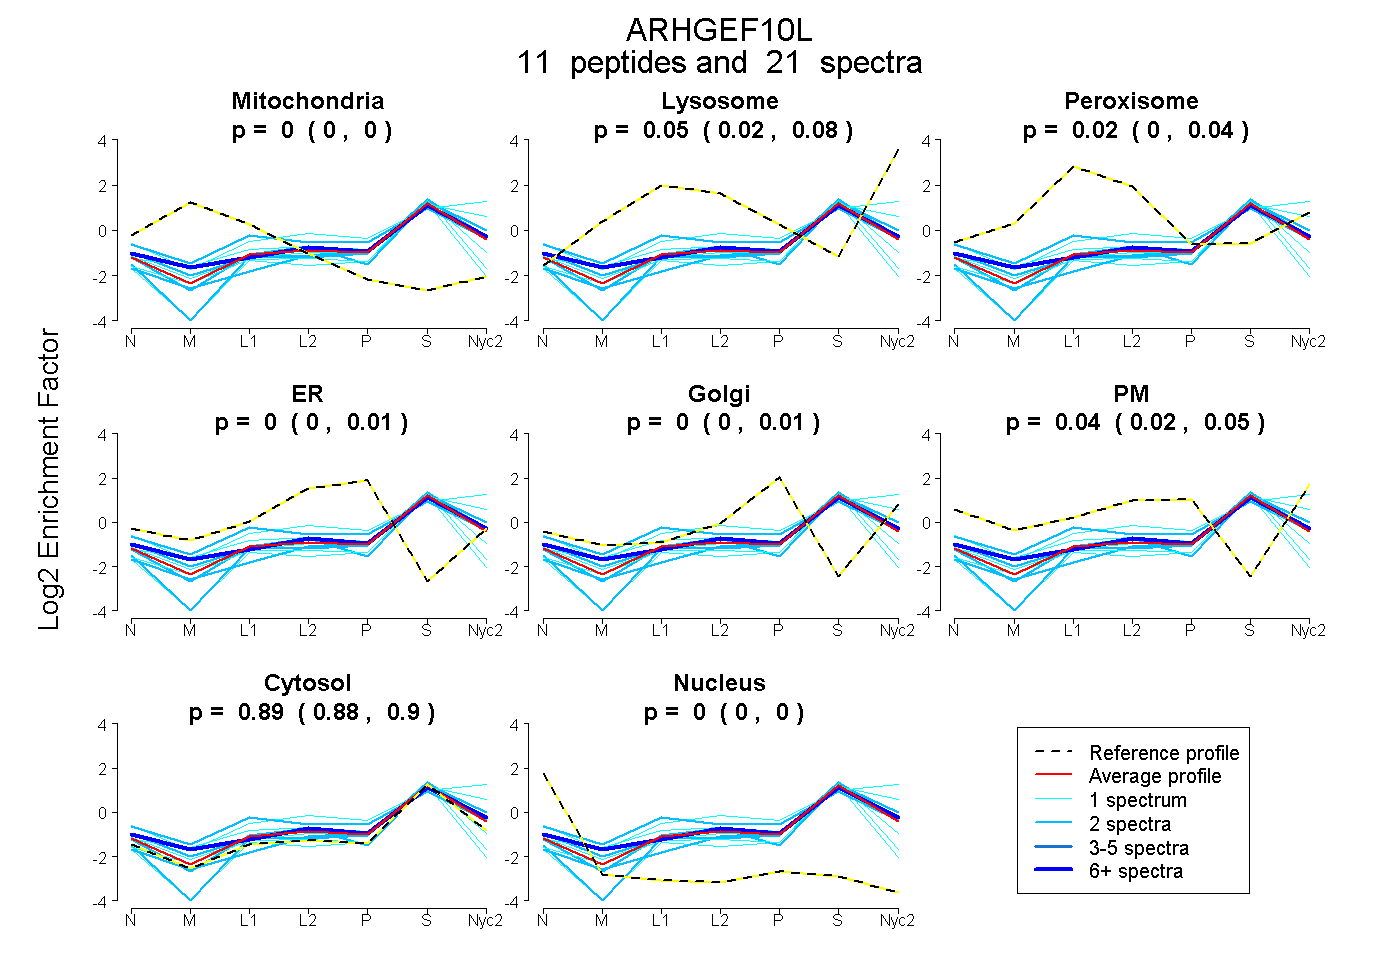
0.000 | 0.000
0.021 | 0.078
0.000 | 0.044
0.000 | 0.015
0.000 | 0.008
0.015 | 0.051
0.876 | 0.895
0.000 | 0.000
4peptides
spectra
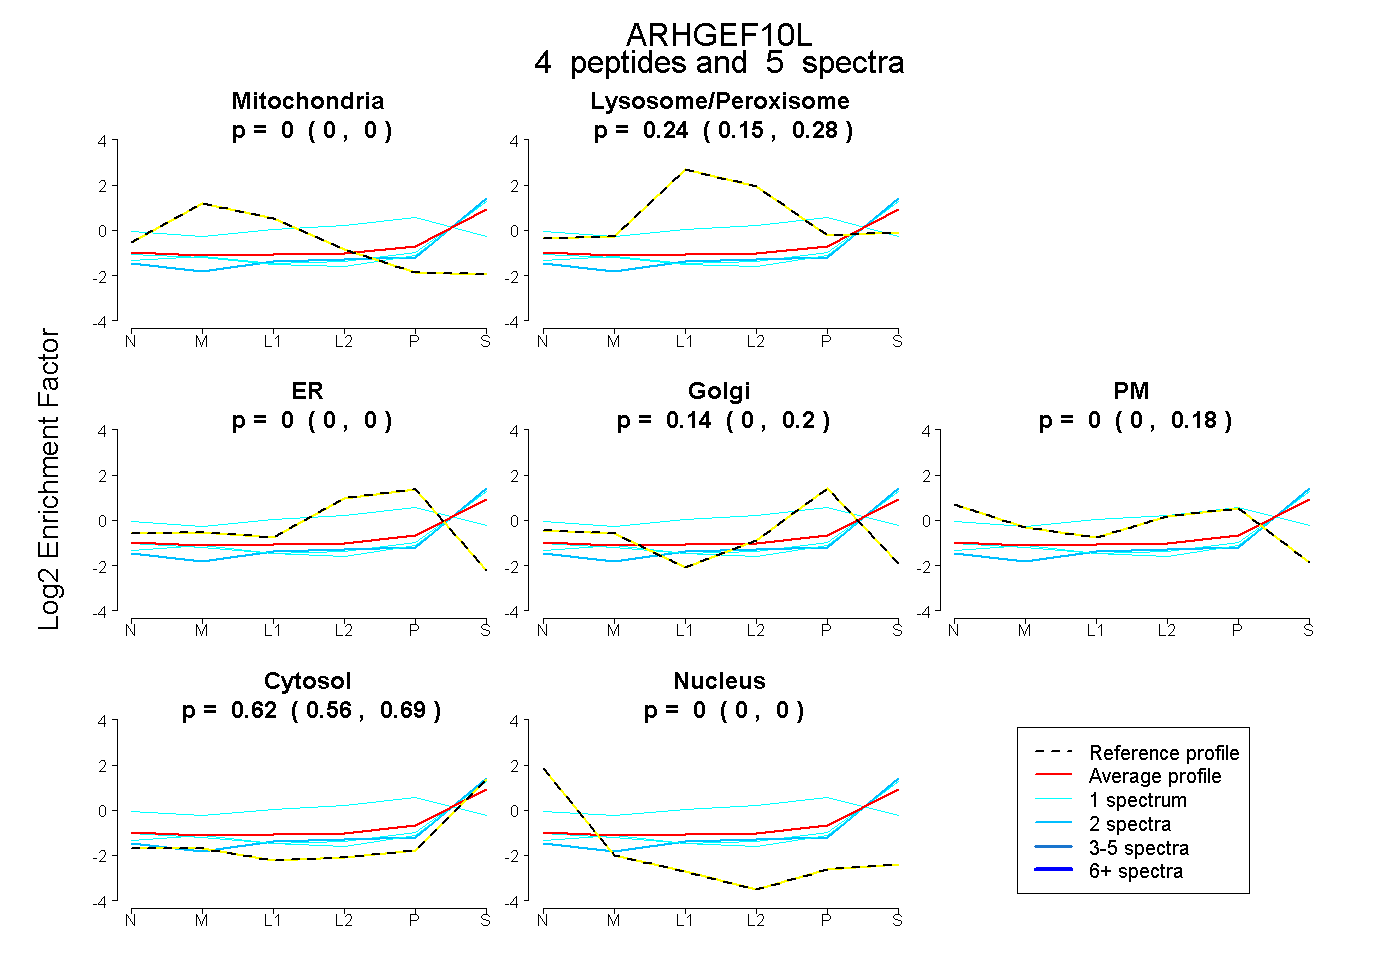
0.000 | 0.000
0.146 | 0.275
0.000 | 0.000
0.000 | 0.200
0.000 | 0.175
0.556 | 0.687
0.000 | 0.002