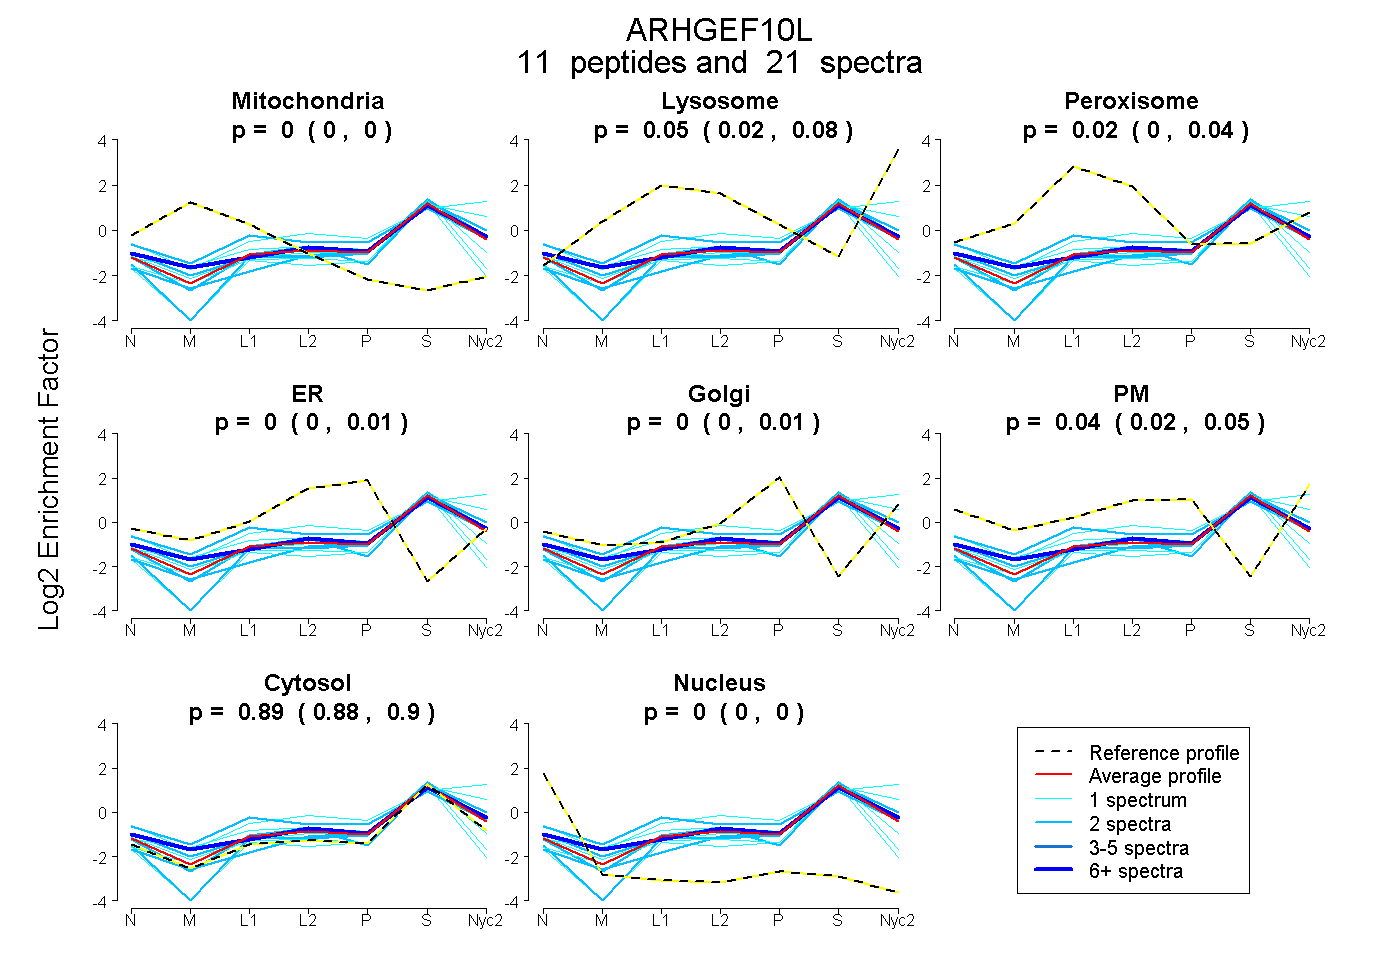
 11
11peptides
spectra
0.000 | 0.000
0.021 | 0.078
0.000 | 0.044
0.000 | 0.015
0.000 | 0.008
0.015 | 0.051
0.876 | 0.895
0.000 | 0.000
| Plot | Mito | Lyso | Perox | ER | Golgi | PM | Cytosol | Nucleus | |||||
| Expt A |
11 peptides |
21 spectra |
|
0.000 0.000 | 0.000 |
0.053 0.021 | 0.078 |
0.018 0.000 | 0.044 |
0.000 0.000 | 0.015 |
0.000 0.000 | 0.008 |
0.041 0.015 | 0.051 |
0.888 0.876 | 0.895 |
0.000 0.000 | 0.000 |
| 6 spectra, VAEWDSTEK | 0.000 | 0.059 | 0.027 | 0.000 | 0.000 | 0.093 | 0.821 | 0.000 | ||
| 1 spectrum, TLLSLEDAAWASCGAR | 0.012 | 0.000 | 0.014 | 0.000 | 0.000 | 0.000 | 0.973 | 0.000 | ||
| 2 spectra, GILLQYR | 0.000 | 0.000 | 0.000 | 0.000 | 0.000 | 0.000 | 1.000 | 0.000 | ||
| 2 spectra, LFQELQDLQK | 0.000 | 0.101 | 0.000 | 0.000 | 0.000 | 0.000 | 0.899 | 0.000 | ||
| 1 spectrum, EICSVAIISGGQGYR | 0.000 | 0.000 | 0.000 | 0.000 | 0.000 | 0.000 | 0.962 | 0.038 | ||
| 2 spectra, ISWVNR | 0.000 | 0.014 | 0.000 | 0.000 | 0.043 | 0.000 | 0.943 | 0.000 | ||
| 1 spectrum, SPGPQPVLCLR | 0.056 | 0.000 | 0.000 | 0.041 | 0.000 | 0.000 | 0.868 | 0.035 | ||
| 2 spectra, ATAAGQAQNK | 0.000 | 0.030 | 0.000 | 0.000 | 0.000 | 0.102 | 0.867 | 0.000 | ||
| 2 spectra, STAHLPGPLLSVR | 0.000 | 0.000 | 0.251 | 0.000 | 0.051 | 0.034 | 0.664 | 0.000 | ||
| 1 spectrum, TTFLLPGQK | 0.000 | 0.247 | 0.000 | 0.000 | 0.000 | 0.000 | 0.753 | 0.000 | ||
| 1 spectrum, LLTSGQR | 0.000 | 0.286 | 0.000 | 0.000 | 0.000 | 0.101 | 0.613 | 0.000 |
| Plot | Mito | Lyso or Perox | ER | Golgi | PM | Cytosol | Nucleus | ||||||
| Expt B |
4 peptides |
5 spectra |
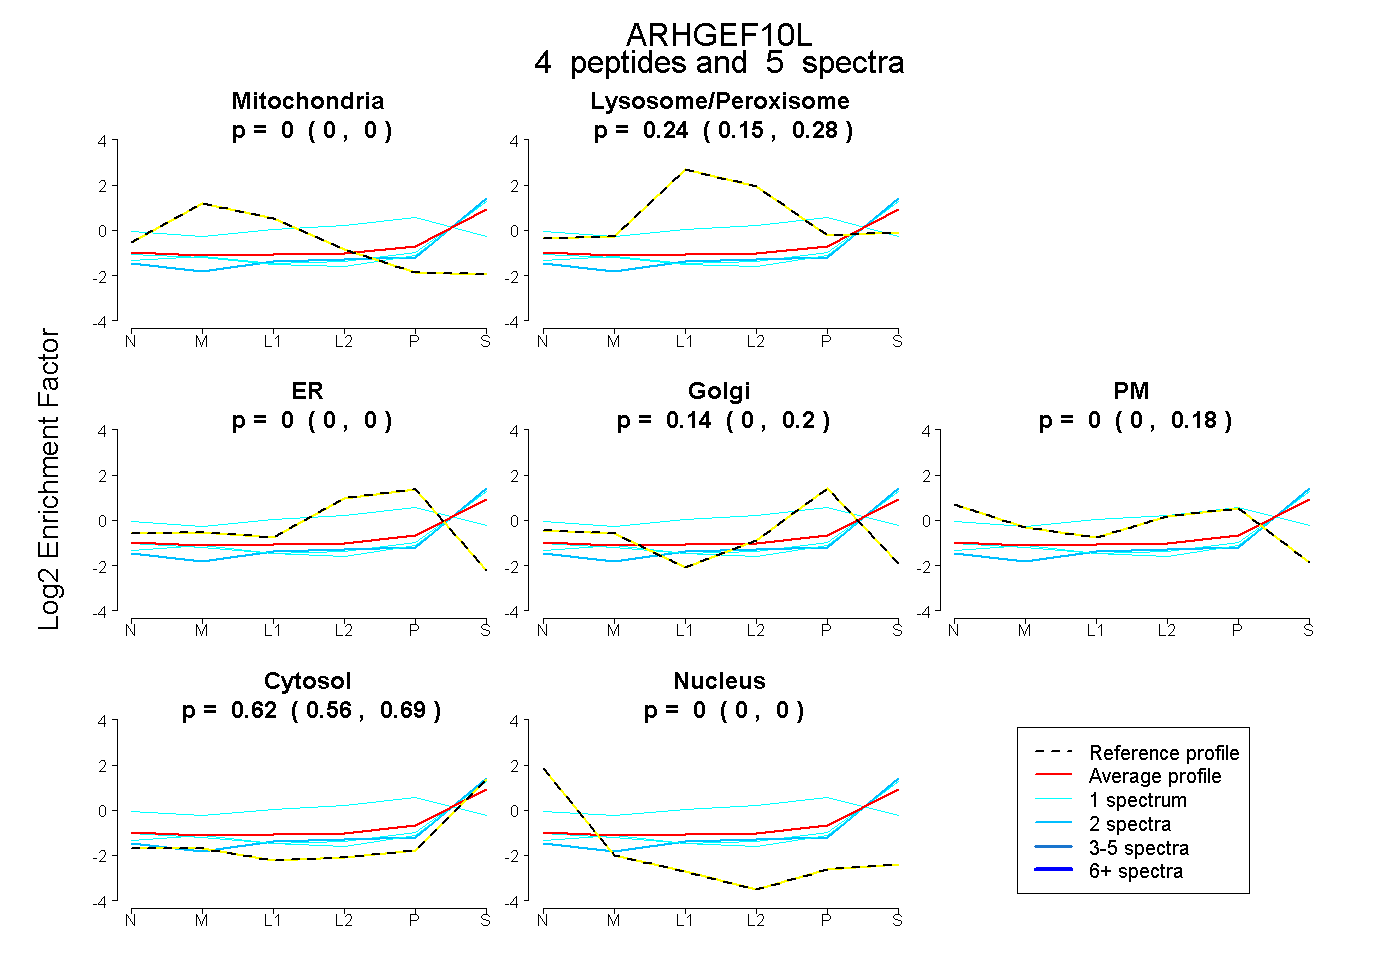 |
0.000 0.000 | 0.000 |
0.236 0.146 | 0.275 |
0.000 0.000 | 0.000 |
0.140 0.000 | 0.200 |
0.000 0.000 | 0.175 |
0.624 0.556 | 0.687 |
0.000 0.000 | 0.002 |
|||
| Plot | Lyso | Other | |||||||||||
| Expt C |
2 peptides |
6 spectra |
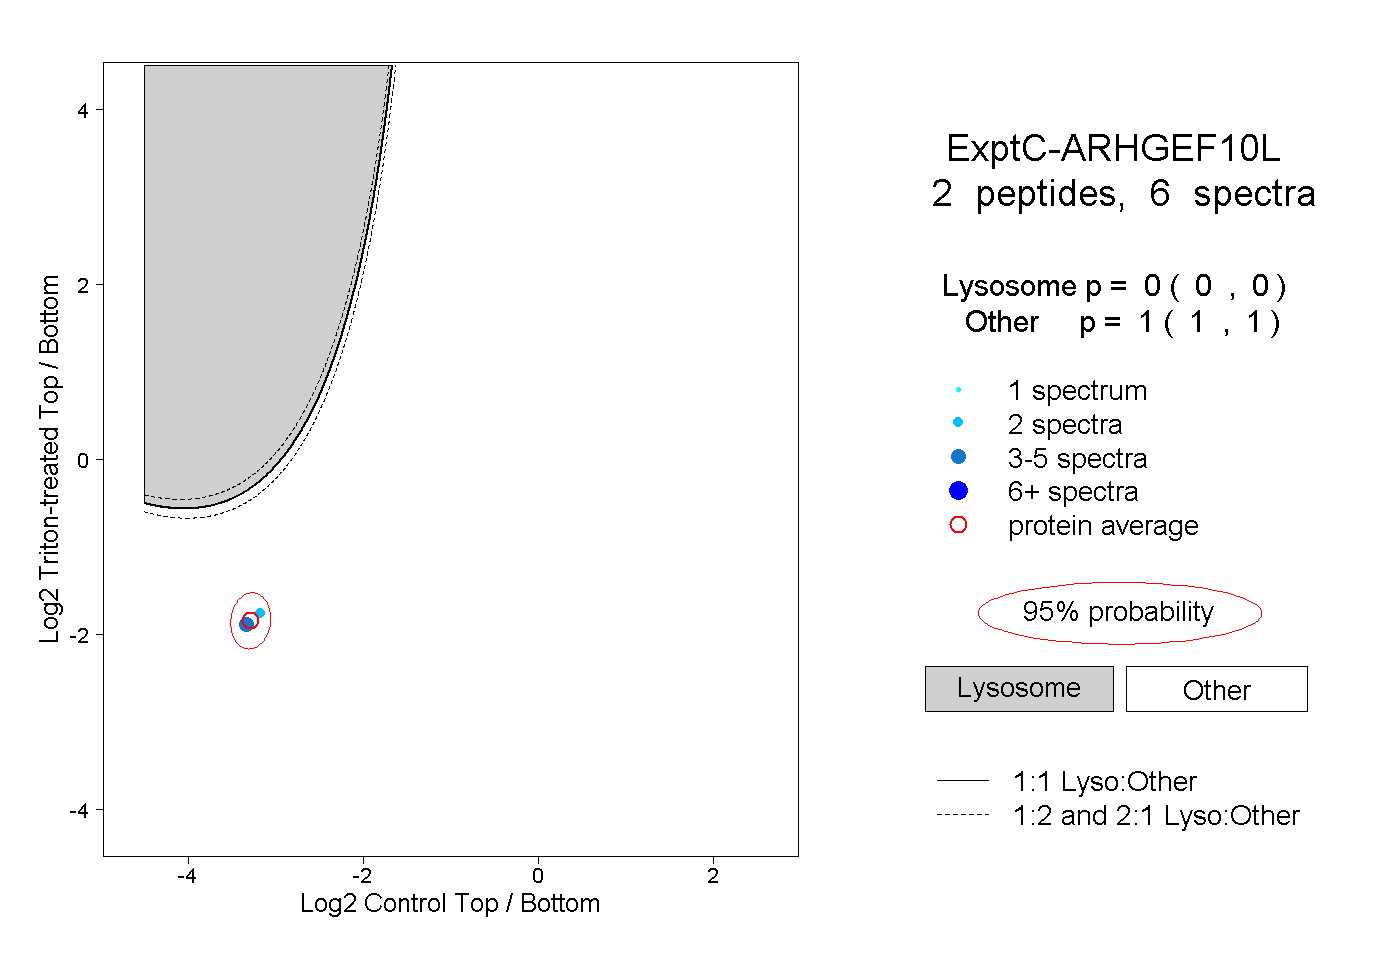 |
0.000 0.000 | 0.000 |
1.000 1.000 | 1.000 |