12
12peptides
spectra
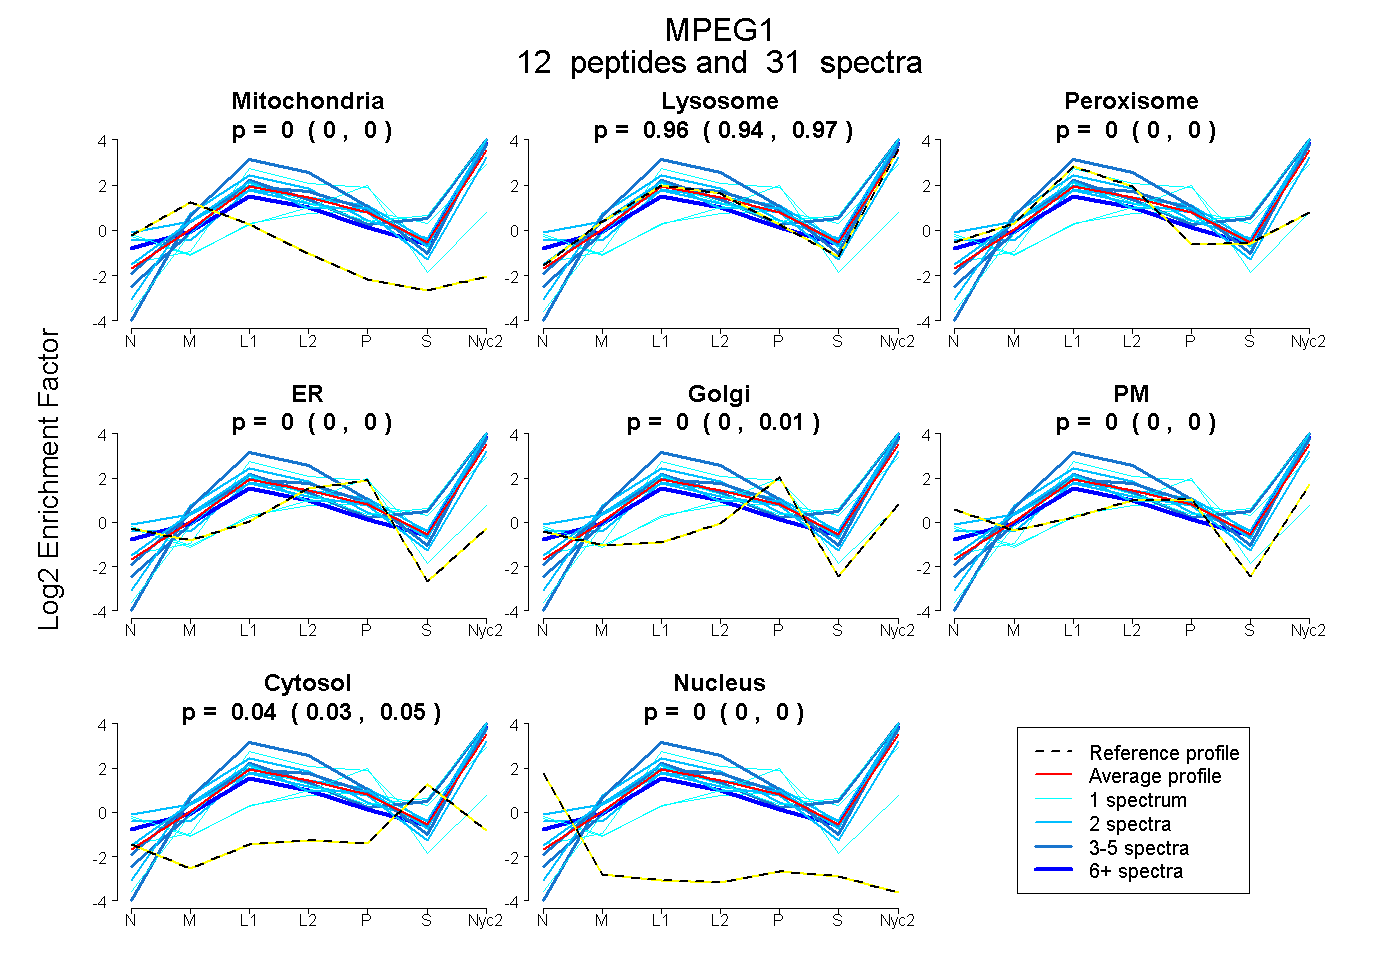
0.000 | 0.000
0.944 | 0.965
0.000 | 0.000
0.000 | 0.000
0.000 | 0.011
0.000 | 0.000
0.032 | 0.051
0.000 | 0.000
6peptides
spectra
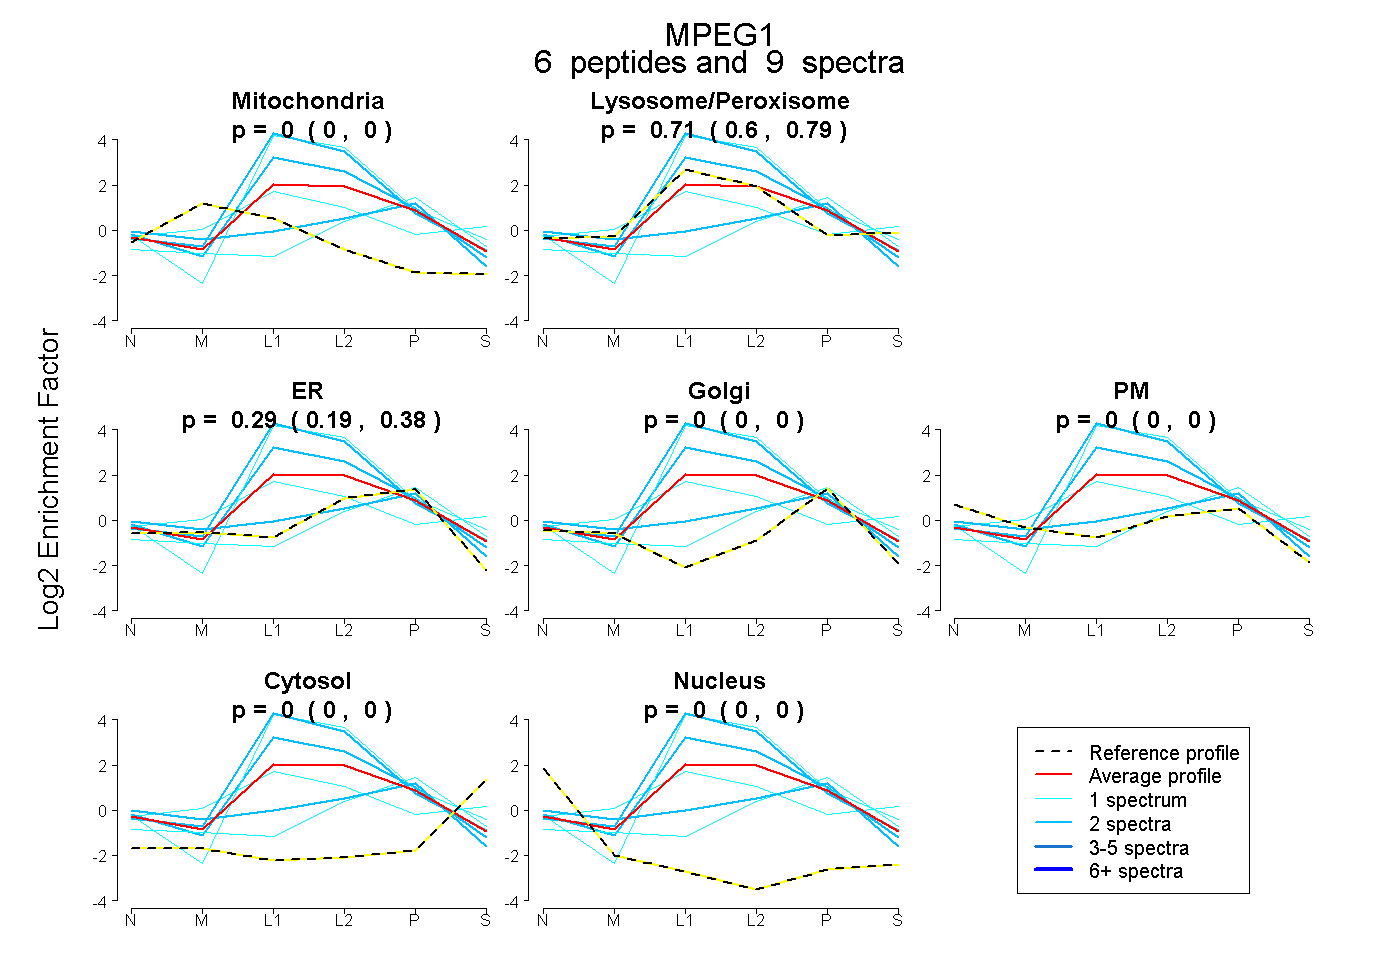
0.000 | 0.000
0.600 | 0.795
0.191 | 0.380
0.000 | 0.000
0.000 | 0.000
0.000 | 0.000
0.000 | 0.000
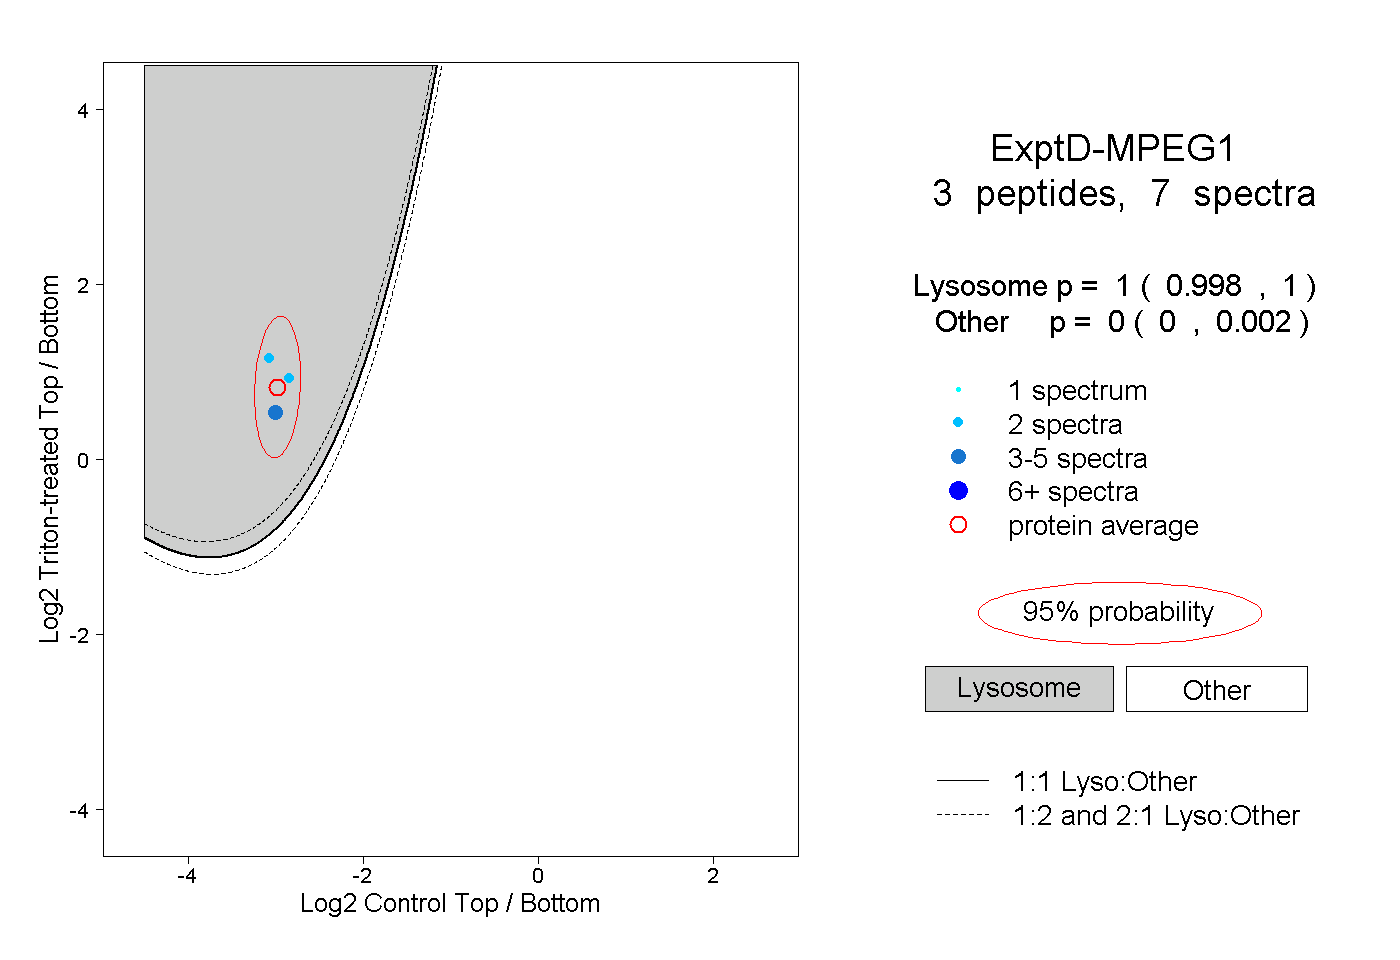
16peptides
spectra
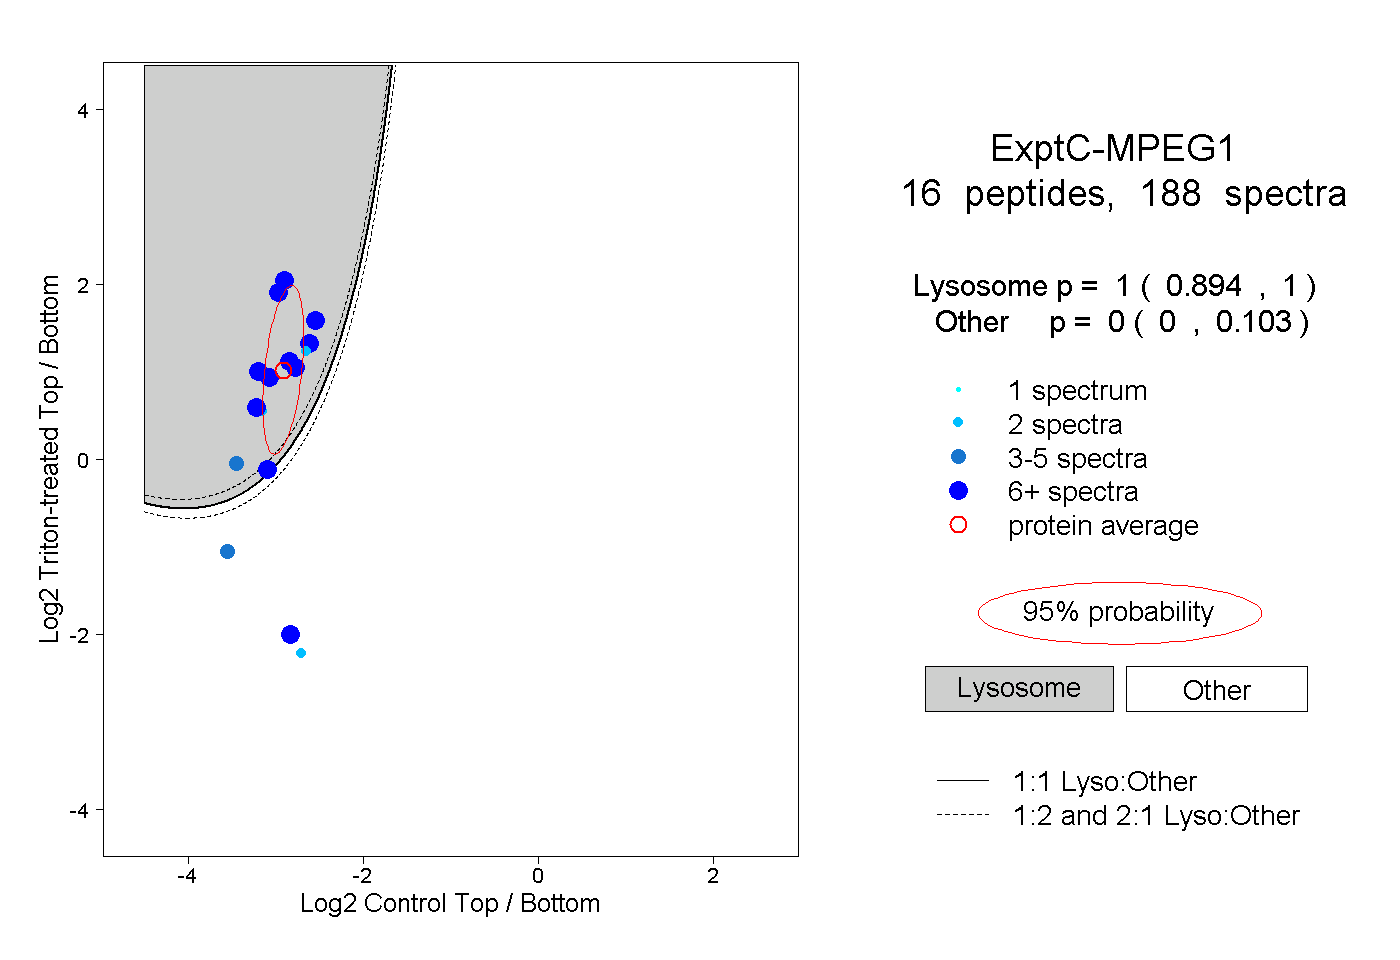
0.894 | 1.000
0.000 | 0.103