MPEG1
[ENSRNOP00000066960]
Main page
| | | Plot |
Mito |
Lyso |
|
Perox |
ER |
Golgi |
PM |
Cytosol |
Nucleus |
|
| Expt A |
 12
12
peptides |
31
spectra |
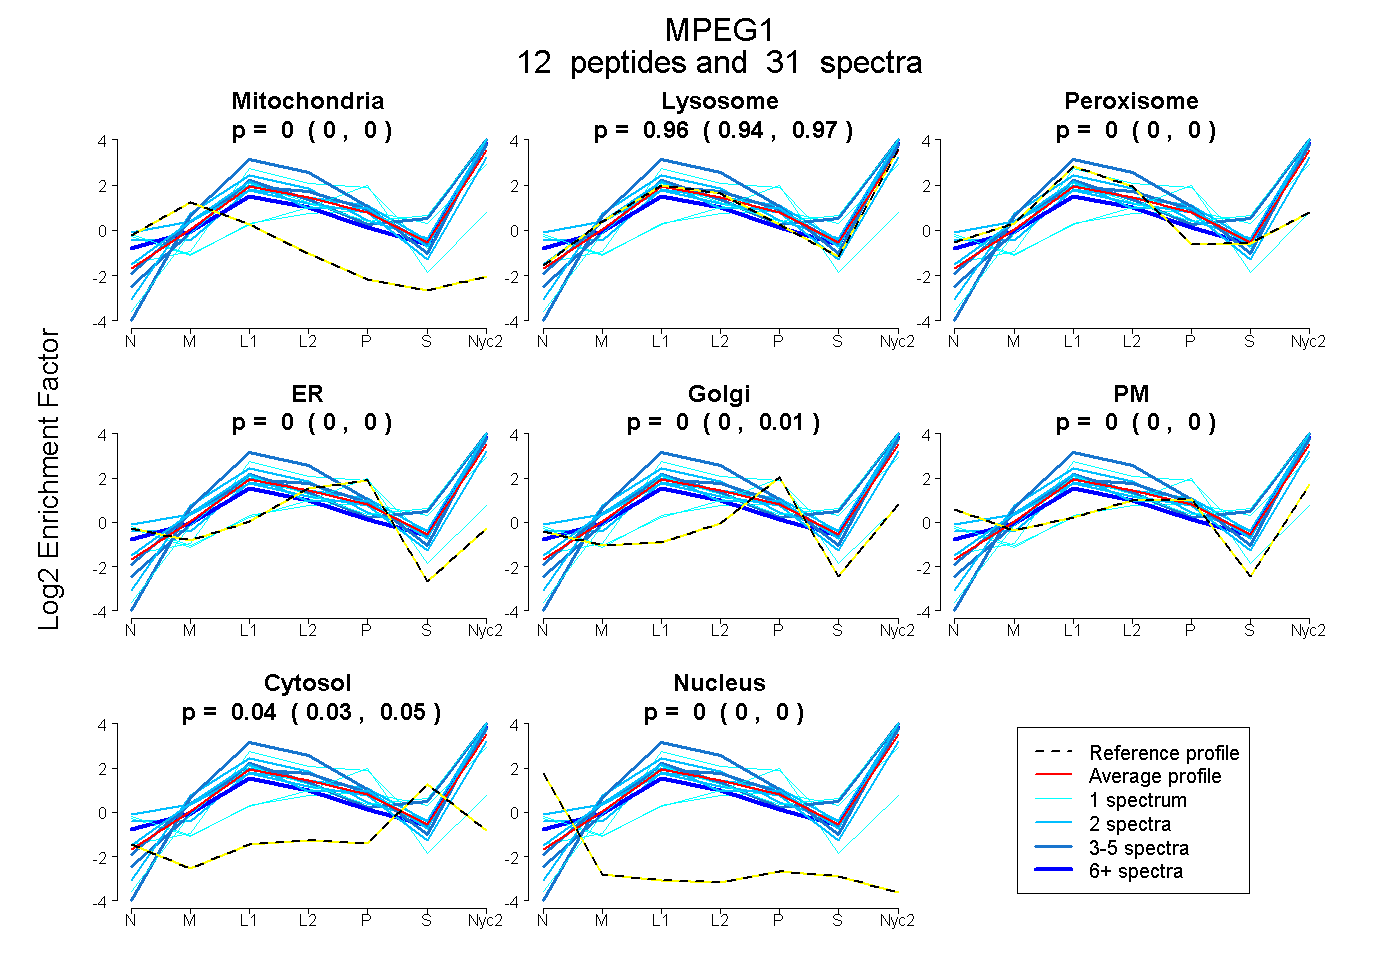 |
0.000
0.000 | 0.000 |
0.957
0.944 | 0.965 |
|
0.000
0.000 | 0.000 |
0.000
0.000 | 0.000 |
0.000
0.000 | 0.011 |
0.000
0.000 | 0.000 |
0.043
0.032 | 0.051 |
0.000
0.000 | 0.000 |
|
| | | Plot |
Mito |
|
Lyso or Perox |
|
ER |
Golgi |
PM |
Cytosol |
Nucleus |
|
| Expt B |
6
peptides |
9
spectra |
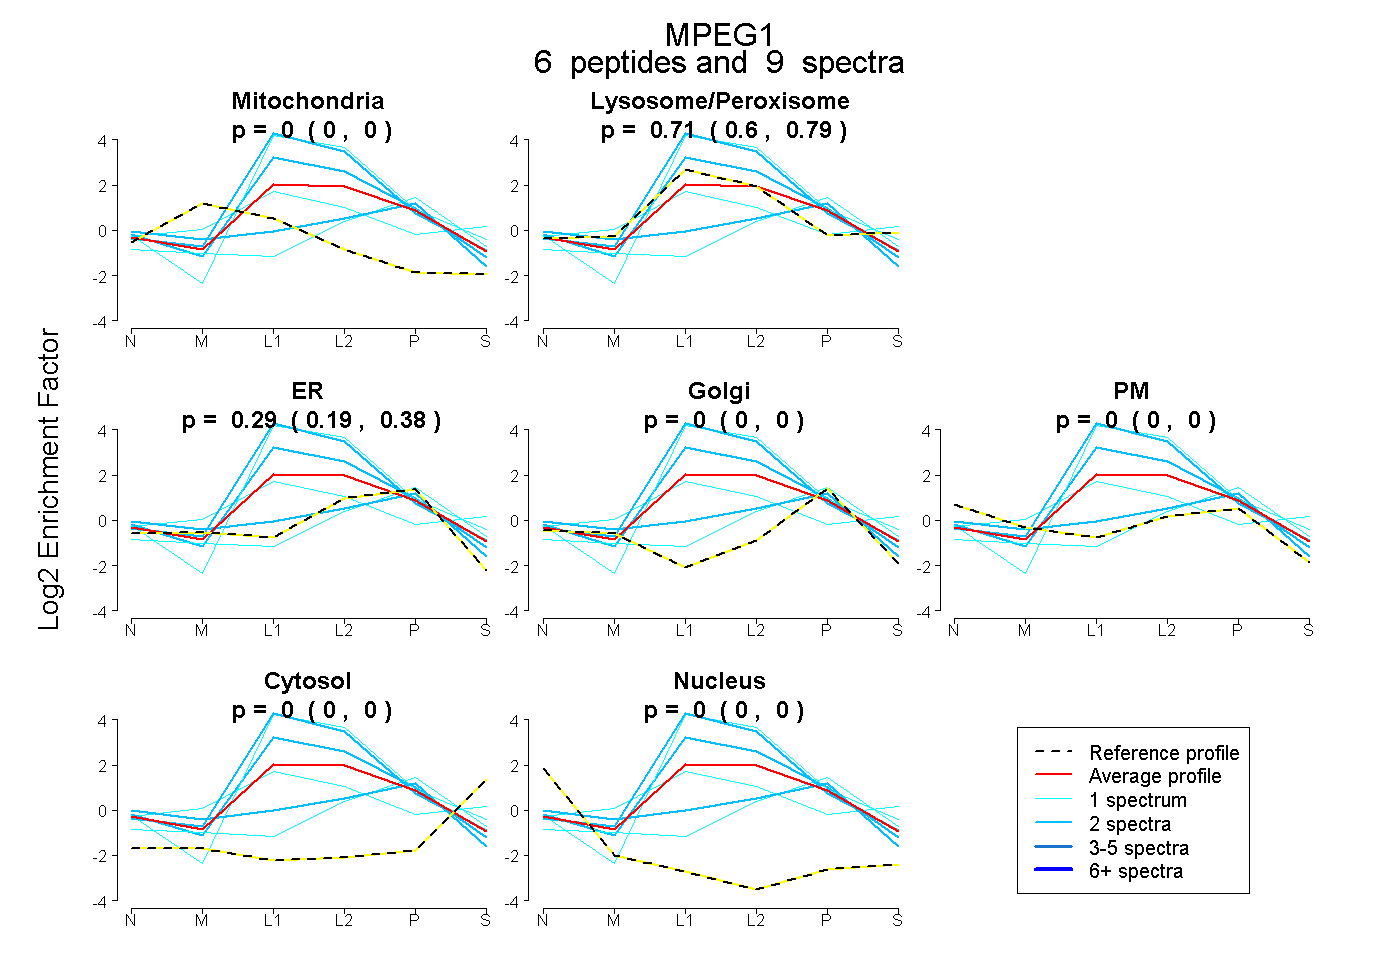 |
0.000
0.000 | 0.000 |
|
0.706
0.600 | 0.795 |
|
0.294
0.191 | 0.380 |
0.000
0.000 | 0.000 |
0.000
0.000 | 0.000 |
0.000
0.000 | 0.000 |
0.000
0.000 | 0.000 |
|
| 2 spectra, TVETAVR |
0.000 |
|
1.000 |
|
0.000 |
0.000 |
0.000 |
0.000 |
0.000 |
|
| 2 spectra, SYLSDR |
0.000 |
|
0.230 |
|
0.339 |
0.187 |
0.244 |
0.000 |
0.000 |
|
| 1 spectrum, LGEPLELHR |
0.000 |
|
0.038 |
|
0.653 |
0.109 |
0.000 |
0.201 |
0.000 |
|
| 2 spectra, FSTEFQR |
0.000 |
|
0.903 |
|
0.097 |
0.000 |
0.000 |
0.000 |
0.000 |
|
| 1 spectrum, DQAVTTR |
0.059 |
|
0.756 |
|
0.000 |
0.040 |
0.036 |
0.111 |
0.000 |
|
| 1 spectrum, LPGLPGPLVK |
0.000 |
|
1.000 |
|
0.000 |
0.000 |
0.000 |
0.000 |
0.000 |
|
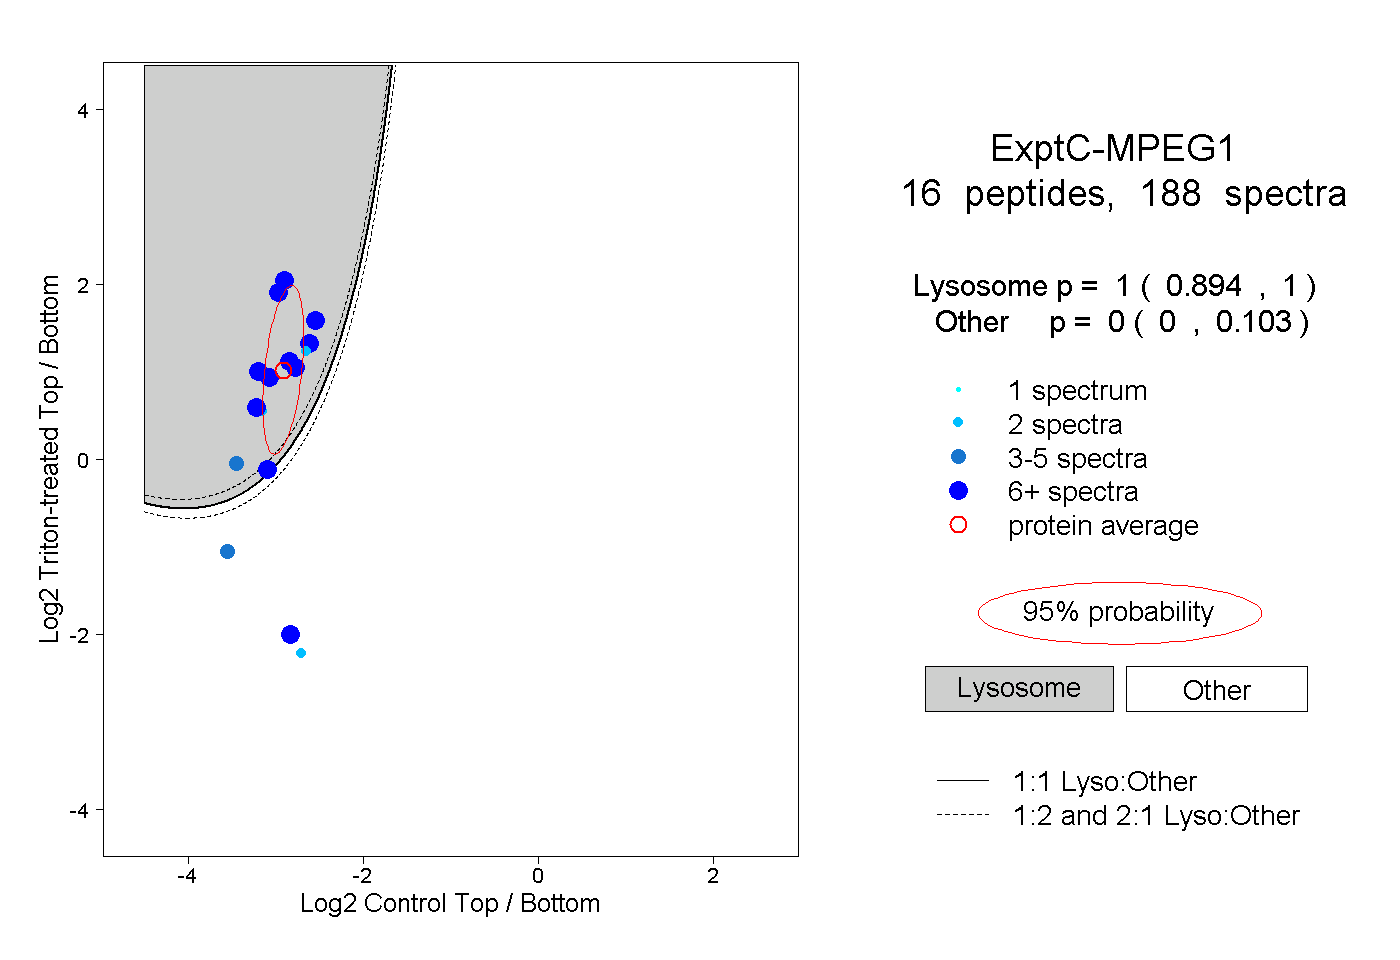
| | | Plot |
|
Lyso |
|
|
|
|
|
|
|
Other |
| Expt C |
16
peptides |
188
spectra |
 |
|
1.000
0.894 | 1.000 |
|
|
|
|
|
|
|
0.000
0.000 | 0.103 |
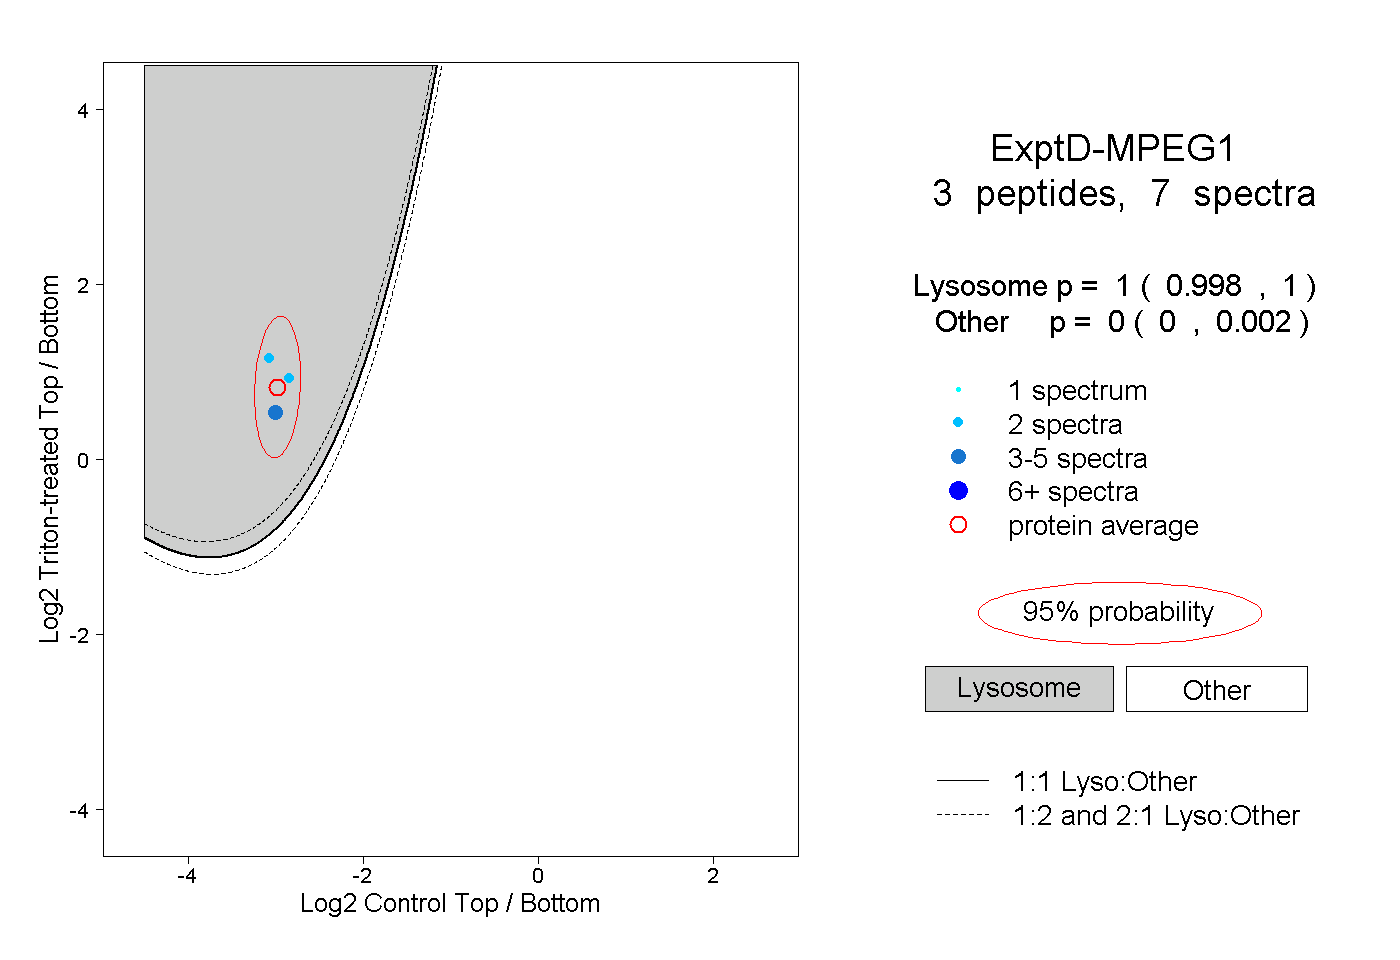
| | | Plot |
|
Lyso |
|
|
|
|
|
|
|
Other |
| Expt D |
3
peptides |
7
spectra |
 |
|
1.000
0.998 | 1.000 |
|
|
|
|
|
|
|
0.000
0.000 | 0.002 |