 12
12peptides
spectra
0.000 | 0.000
0.944 | 0.965
0.000 | 0.000
0.000 | 0.000
0.000 | 0.011
0.000 | 0.000
0.032 | 0.051
0.000 | 0.000
| Plot | Mito | Lyso | Perox | ER | Golgi | PM | Cytosol | Nucleus | |||||
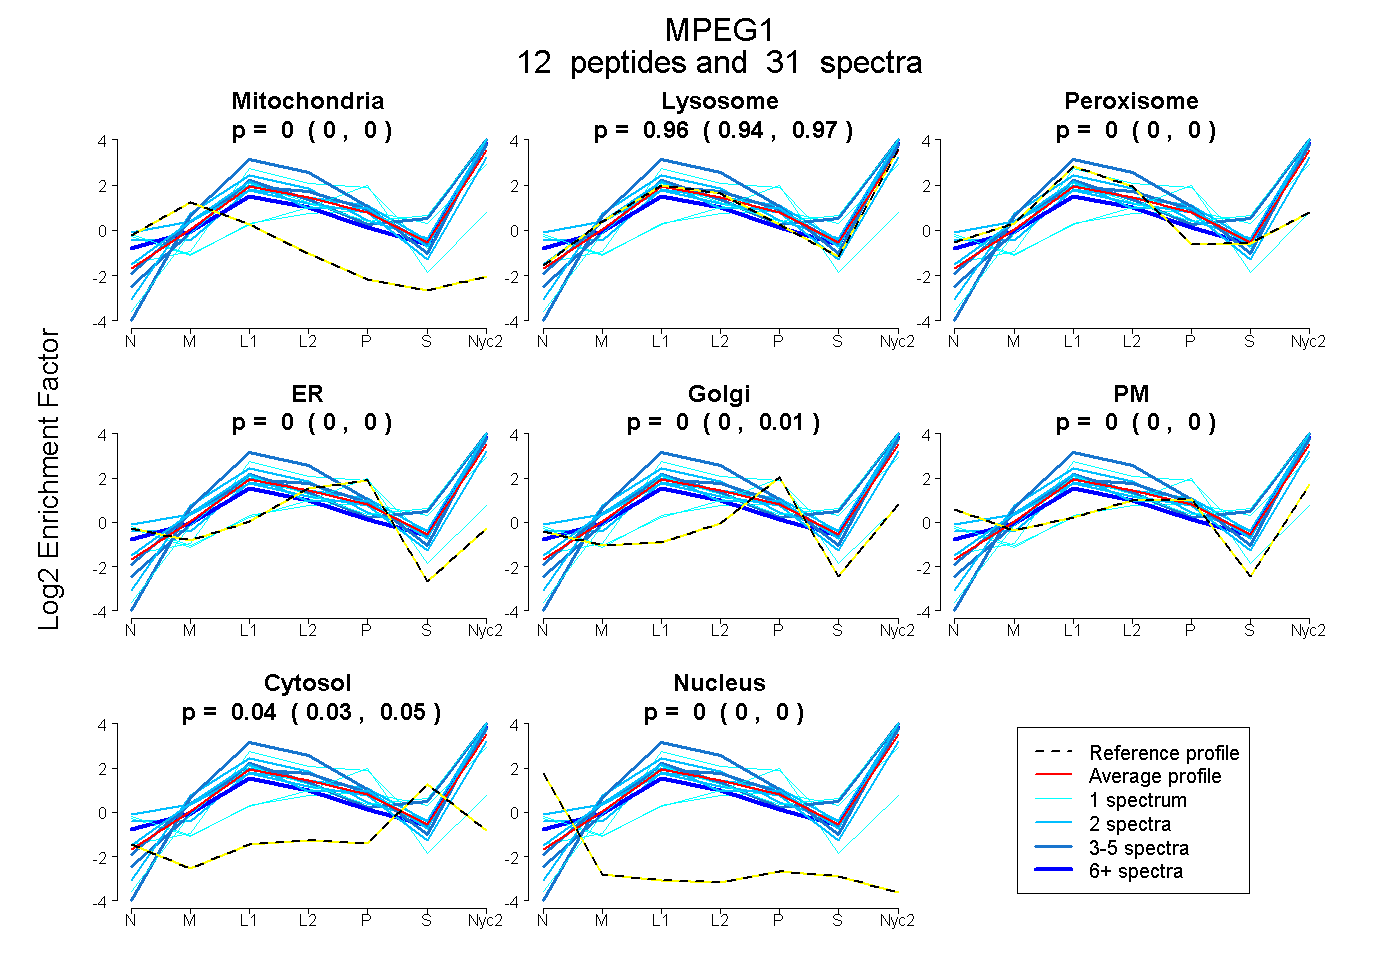
| Expt A |
12 peptides |
31 spectra |
|
0.000 0.000 | 0.000 |
0.957 0.944 | 0.965 |
0.000 0.000 | 0.000 |
0.000 0.000 | 0.000 |
0.000 0.000 | 0.011 |
0.000 0.000 | 0.000 |
0.043 0.032 | 0.051 |
0.000 0.000 | 0.000 |
| 3 spectra, TVETAVR | 0.000 | 1.000 | 0.000 | 0.000 | 0.000 | 0.000 | 0.000 | 0.000 | ||
| 2 spectra, TVCEDVFR | 0.000 | 0.649 | 0.010 | 0.000 | 0.000 | 0.341 | 0.000 | 0.000 | ||
| 4 spectra, NIDMGR | 0.000 | 1.000 | 0.000 | 0.000 | 0.000 | 0.000 | 0.000 | 0.000 | ||
| 3 spectra, DQAVTTR | 0.000 | 0.937 | 0.000 | 0.000 | 0.000 | 0.000 | 0.063 | 0.000 | ||
| 2 spectra, VETDHTSQTTLTK | 0.000 | 0.994 | 0.000 | 0.000 | 0.006 | 0.000 | 0.000 | 0.000 | ||
| 1 spectrum, SYLSDR | 0.000 | 0.079 | 0.088 | 0.378 | 0.413 | 0.042 | 0.000 | 0.000 | ||
| 2 spectra, GITNHLVAIDR | 0.000 | 1.000 | 0.000 | 0.000 | 0.000 | 0.000 | 0.000 | 0.000 | ||
| 1 spectrum, DIGAPSLK | 0.000 | 0.509 | 0.000 | 0.000 | 0.012 | 0.222 | 0.257 | 0.000 | ||
| 2 spectra, DPGMTGFQTCK | 0.000 | 0.797 | 0.000 | 0.000 | 0.000 | 0.190 | 0.013 | 0.000 | ||
| 9 spectra, FSTEFQR | 0.000 | 0.868 | 0.000 | 0.000 | 0.000 | 0.051 | 0.081 | 0.000 | ||
| 1 spectrum, AGIFTGGSLLPVR | 0.000 | 0.977 | 0.000 | 0.023 | 0.000 | 0.000 | 0.000 | 0.000 | ||
| 1 spectrum, VQSFGGIPFYPGITLETWQK | 0.000 | 0.924 | 0.000 | 0.000 | 0.000 | 0.000 | 0.076 | 0.000 |
| Plot | Mito | Lyso or Perox | ER | Golgi | PM | Cytosol | Nucleus | ||||||
| Expt B |
6 peptides |
9 spectra |
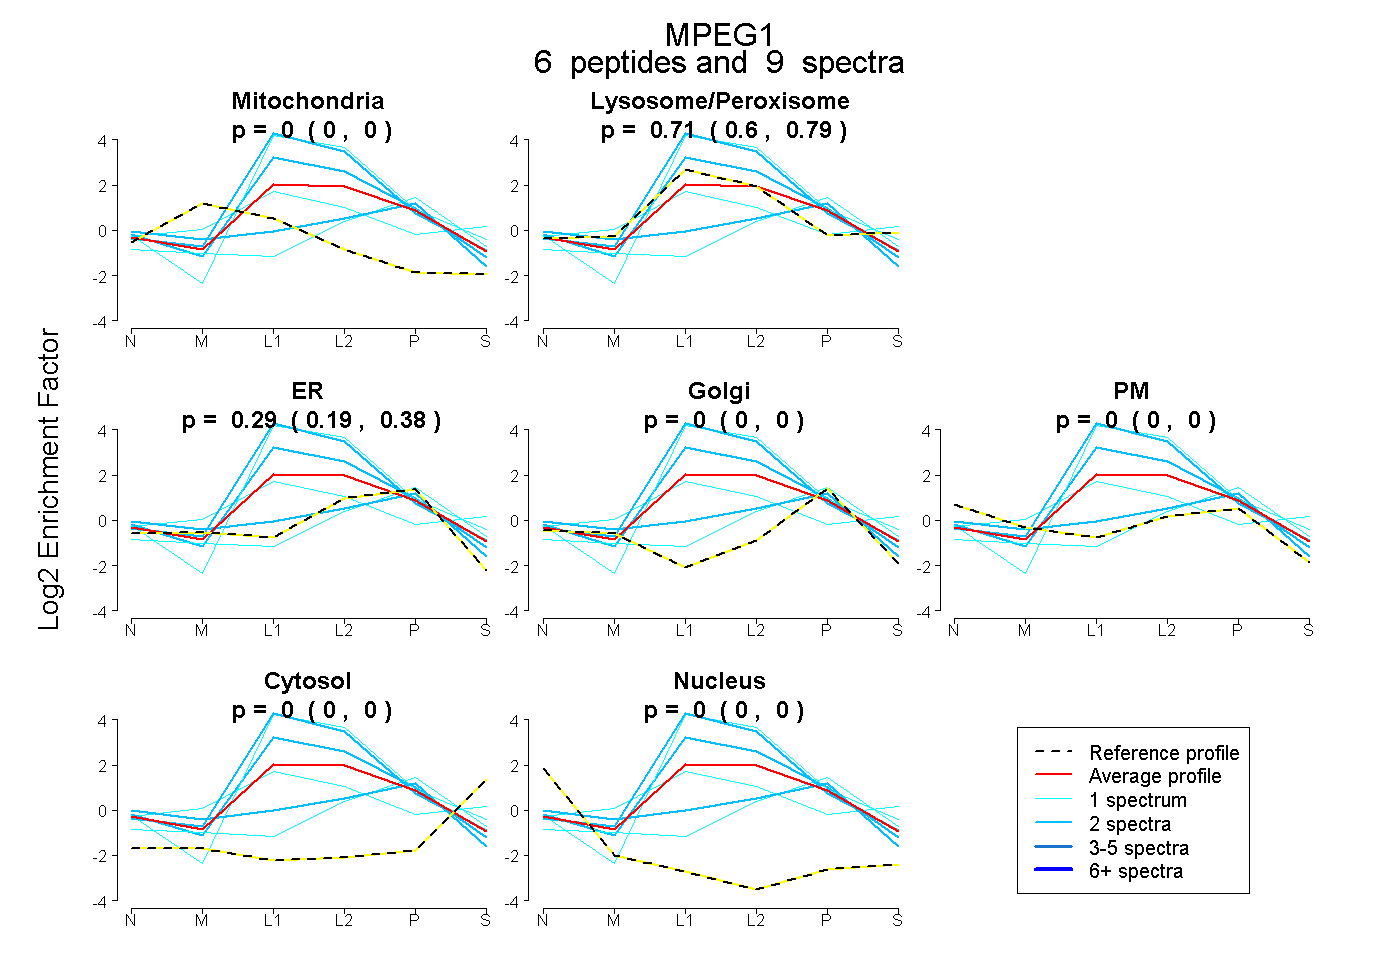 |
0.000 0.000 | 0.000 |
0.706 0.600 | 0.795 |
0.294 0.191 | 0.380 |
0.000 0.000 | 0.000 |
0.000 0.000 | 0.000 |
0.000 0.000 | 0.000 |
0.000 0.000 | 0.000 |
|||
| Plot | Lyso | Other | |||||||||||
| Expt C |
16 peptides |
188 spectra |
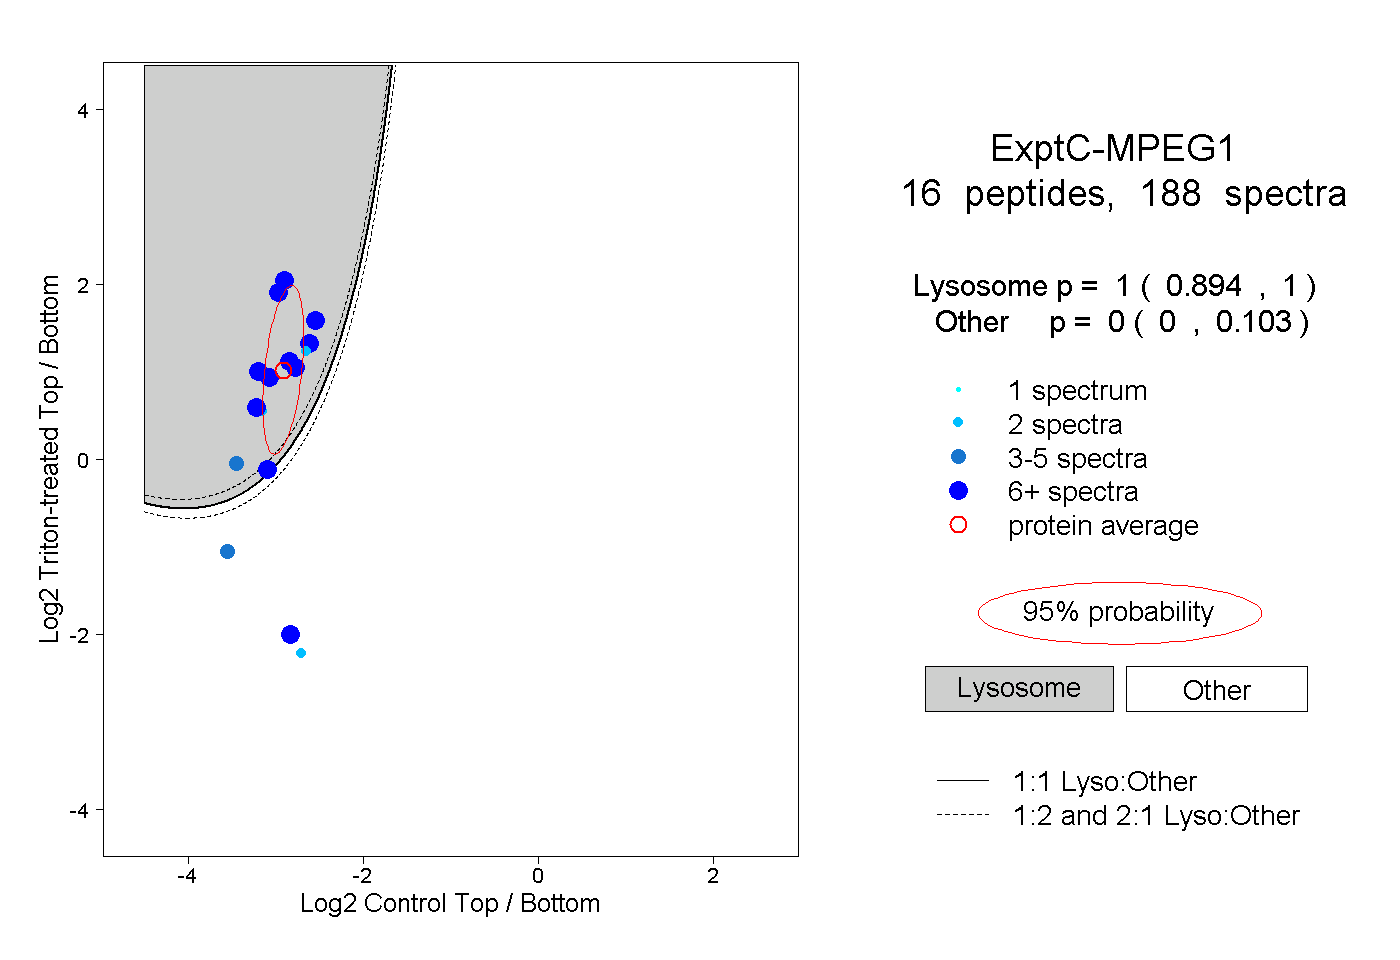 |
1.000 0.894 | 1.000 |
0.000 0.000 | 0.103 |
||||||||
| Plot | Lyso | Other | |||||||||||
| Expt D |
3 peptides |
7 spectra |
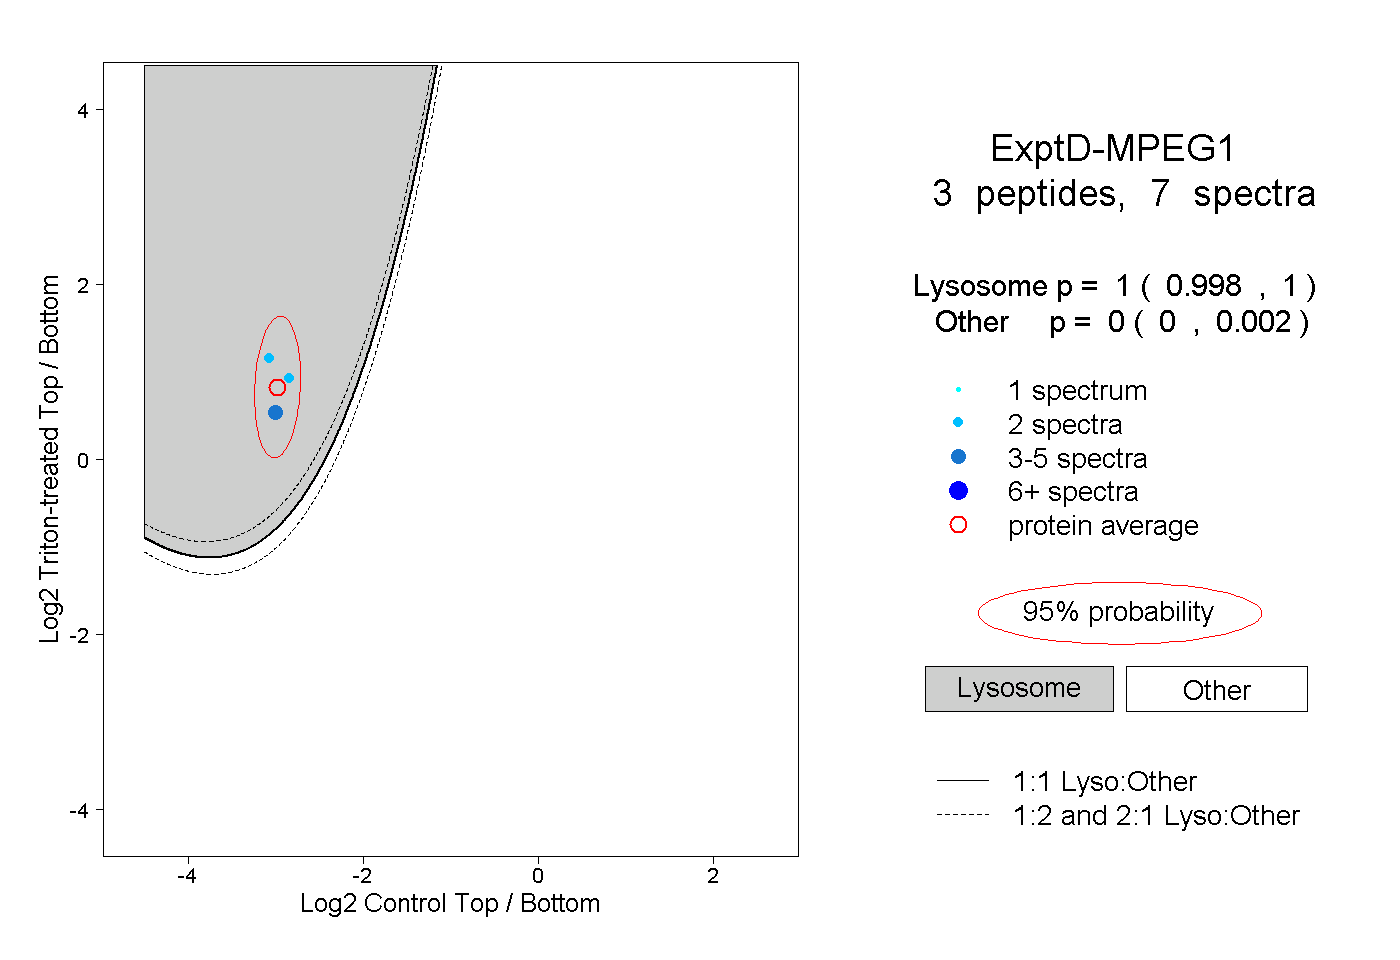 |
1.000 0.998 | 1.000 |
0.000 0.000 | 0.002 |