 6
6peptides
spectra
0.000 | 0.000
0.000 | 0.000
0.000 | 0.050
0.047 | 0.184
0.000 | 0.000
0.186 | 0.345
0.560 | 0.599
0.000 | 0.000
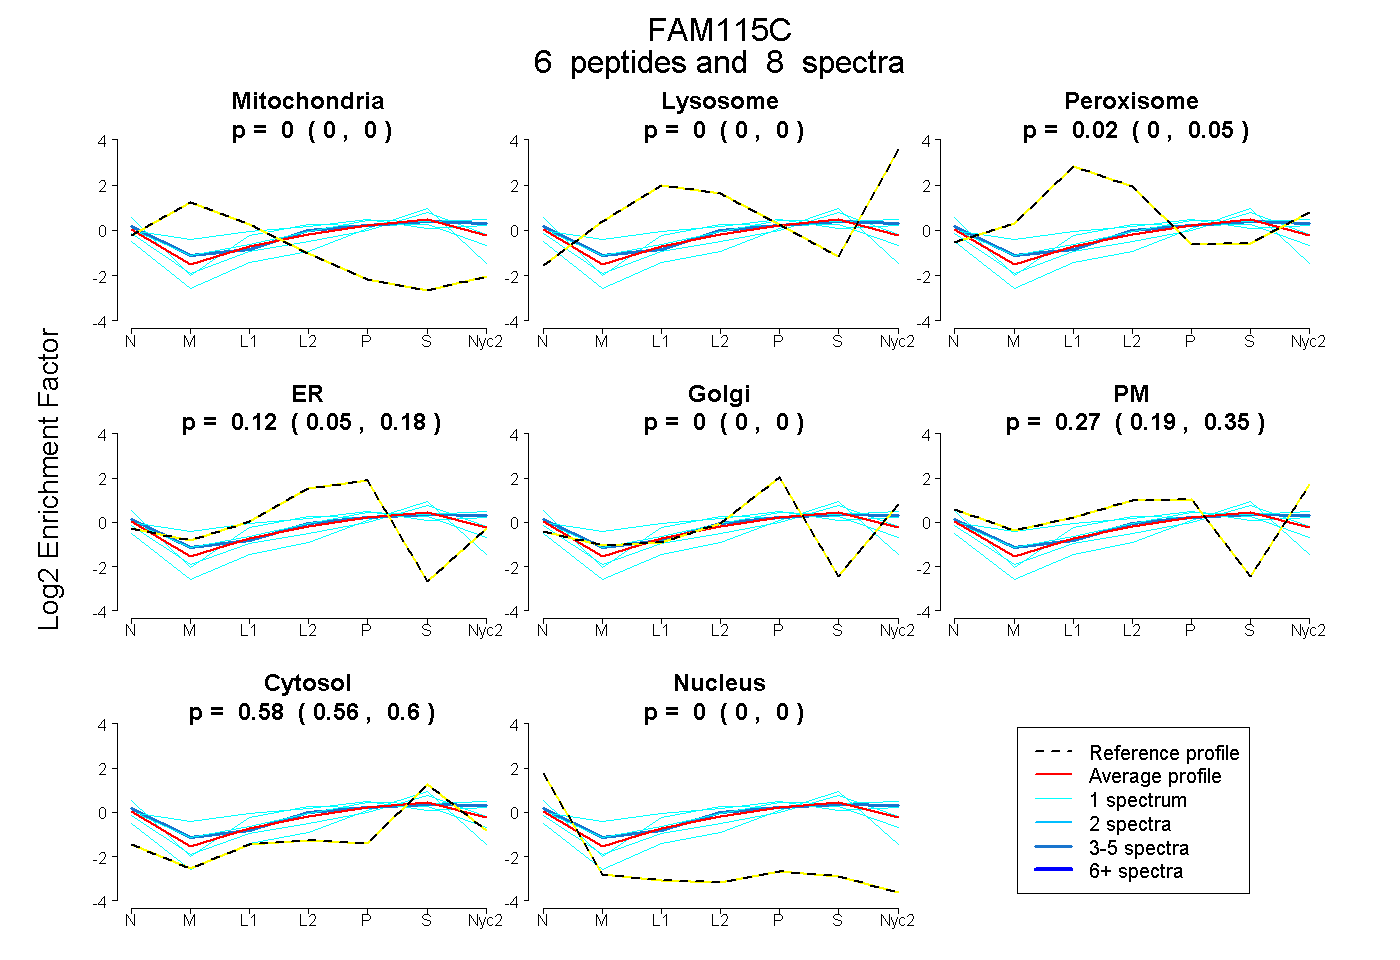
| Plot | Mito | Lyso | Perox | ER | Golgi | PM | Cytosol | Nucleus | |||||
| Expt A |
6 peptides |
8 spectra |
|
0.000 0.000 | 0.000 |
0.000 0.000 | 0.000 |
0.023 0.000 | 0.050 |
0.122 0.047 | 0.184 |
0.000 0.000 | 0.000 |
0.274 0.186 | 0.345 |
0.581 0.560 | 0.599 |
0.000 0.000 | 0.000 |
| 1 spectrum, MNLWLK | 0.000 | 0.000 | 0.037 | 0.000 | 0.000 | 0.467 | 0.497 | 0.000 | ||
| 3 spectra, GLWGPIHELGHNQQR | 0.000 | 0.000 | 0.017 | 0.000 | 0.000 | 0.457 | 0.527 | 0.000 | ||
| 1 spectrum, AVPAPYYK | 0.000 | 0.000 | 0.000 | 0.030 | 0.001 | 0.284 | 0.684 | 0.000 | ||
| 1 spectrum, APVVTYQCCMDR | 0.000 | 0.000 | 0.136 | 0.280 | 0.000 | 0.065 | 0.465 | 0.054 | ||
| 1 spectrum, VQIGCHTDNLSHAR | 0.000 | 0.000 | 0.267 | 0.000 | 0.190 | 0.203 | 0.340 | 0.000 | ||
| 1 spectrum, GCQLGPVSVTITK | 0.000 | 0.000 | 0.000 | 0.183 | 0.000 | 0.000 | 0.763 | 0.055 |