 3
3peptides
spectra
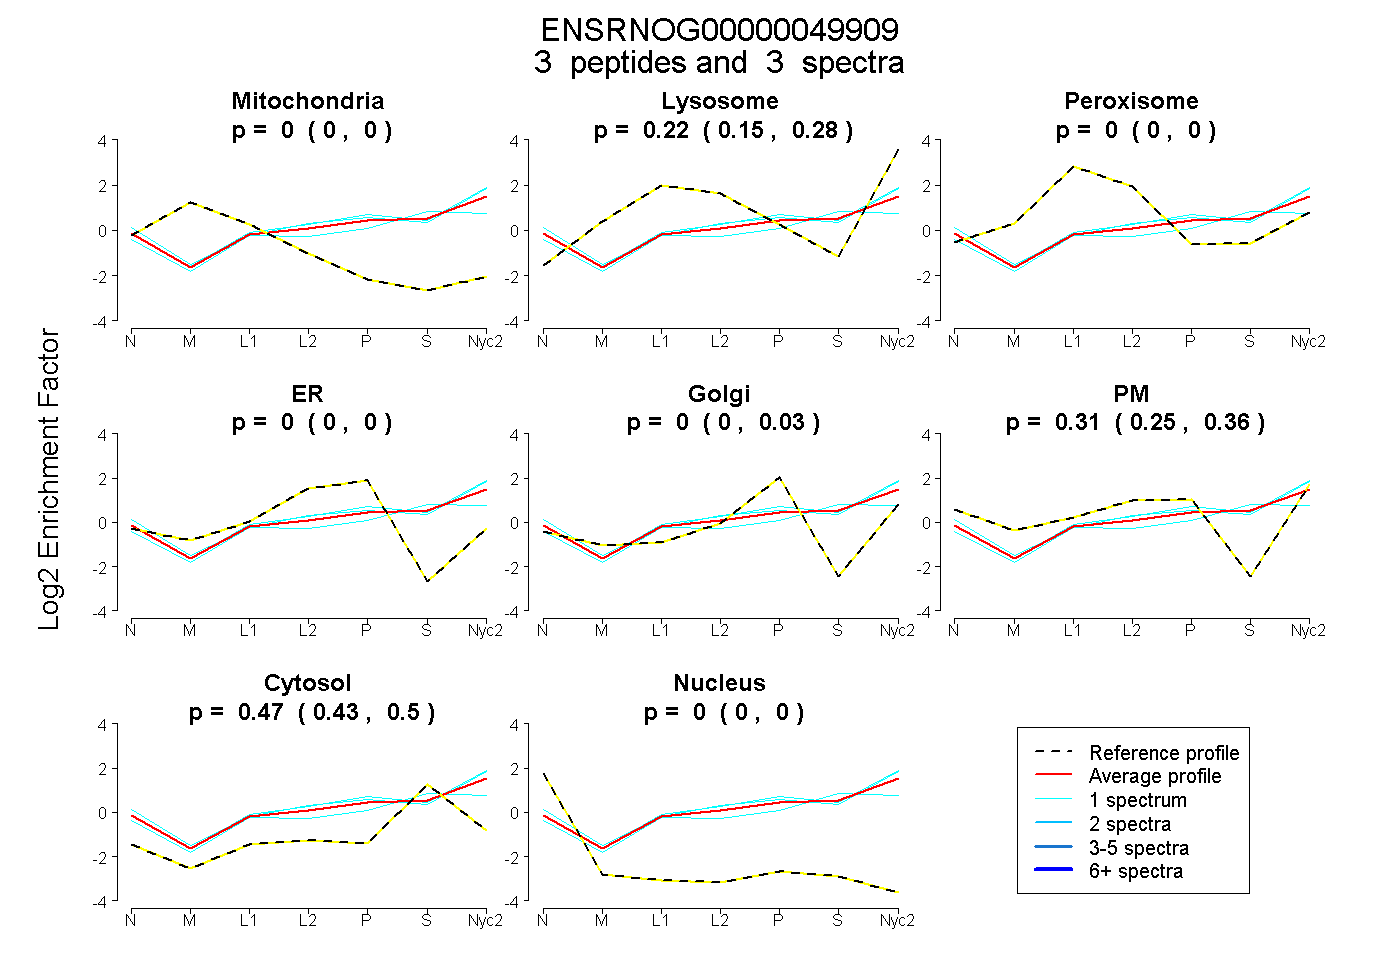
0.000 | 0.000
0.151 | 0.276
0.000 | 0.000
0.000 | 0.000
0.000 | 0.028
0.253 | 0.363
0.429 | 0.495
0.000 | 0.000
| Plot | Mito | Lyso | Perox | ER | Golgi | PM | Cytosol | Nucleus | |||||
| Expt A |
3 peptides |
3 spectra |
|
0.000 0.000 | 0.000 |
0.220 0.151 | 0.276 |
0.000 0.000 | 0.000 |
0.000 0.000 | 0.000 |
0.000 0.000 | 0.028 |
0.315 0.253 | 0.363 |
0.465 0.429 | 0.495 |
0.000 0.000 | 0.000 |
| 1 spectrum, SGQQPK | 0.000 | 0.271 | 0.000 | 0.000 | 0.015 | 0.311 | 0.403 | 0.000 | ||
| 1 spectrum, VTISCR | 0.000 | 0.163 | 0.013 | 0.000 | 0.000 | 0.226 | 0.598 | 0.000 | ||
| 1 spectrum, LLIYSASNLESGVPSR | 0.000 | 0.220 | 0.000 | 0.000 | 0.000 | 0.389 | 0.391 | 0.000 |