 2
2peptides
spectra
0.000 | 0.000
0.000 | 0.061
0.000 | 0.057
0.000 | 0.000
0.462 | 0.604
0.000 | 0.072
0.345 | 0.413
0.000 | 0.000
| Plot | Mito | Lyso | Perox | ER | Golgi | PM | Cytosol | Nucleus | |||||
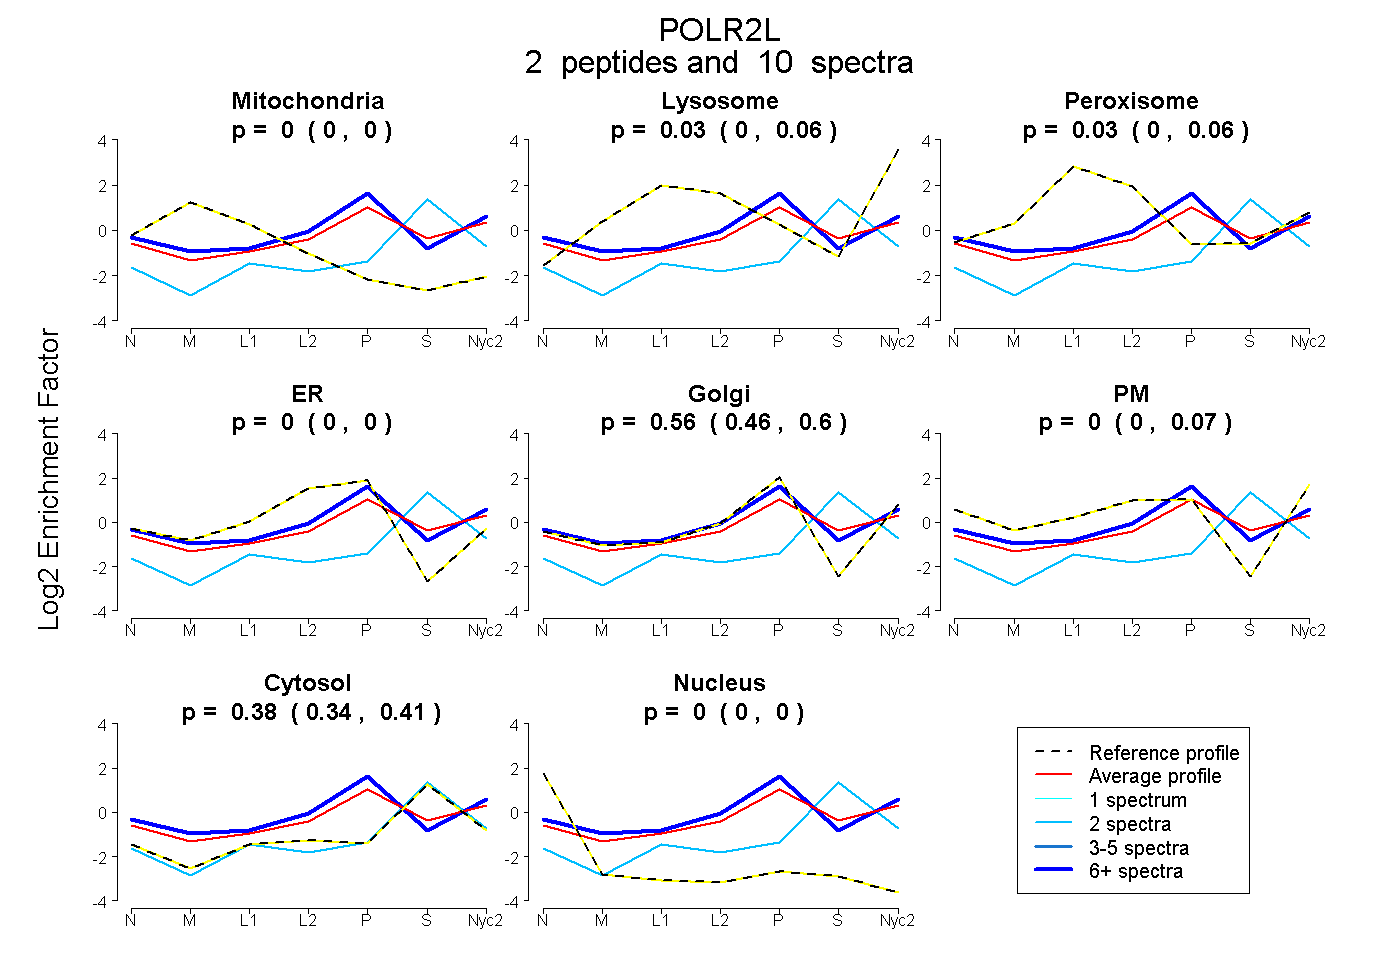
| Expt A |
2 peptides |
10 spectra |
|
0.000 0.000 | 0.000 |
0.032 0.000 | 0.061 |
0.029 0.000 | 0.057 |
0.000 0.000 | 0.000 |
0.560 0.462 | 0.604 |
0.000 0.000 | 0.072 |
0.379 0.345 | 0.413 |
0.000 0.000 | 0.000 |
| 8 spectra, MIIPVR | 0.000 | 0.022 | 0.069 | 0.000 | 0.706 | 0.000 | 0.204 | 0.000 | ||
| 2 spectra, IIPVR | 0.000 | 0.000 | 0.000 | 0.000 | 0.000 | 0.000 | 1.000 | 0.000 |
| Plot | Lyso | Other | |||||||||||
| Expt C |
2 peptides |
6 spectra |
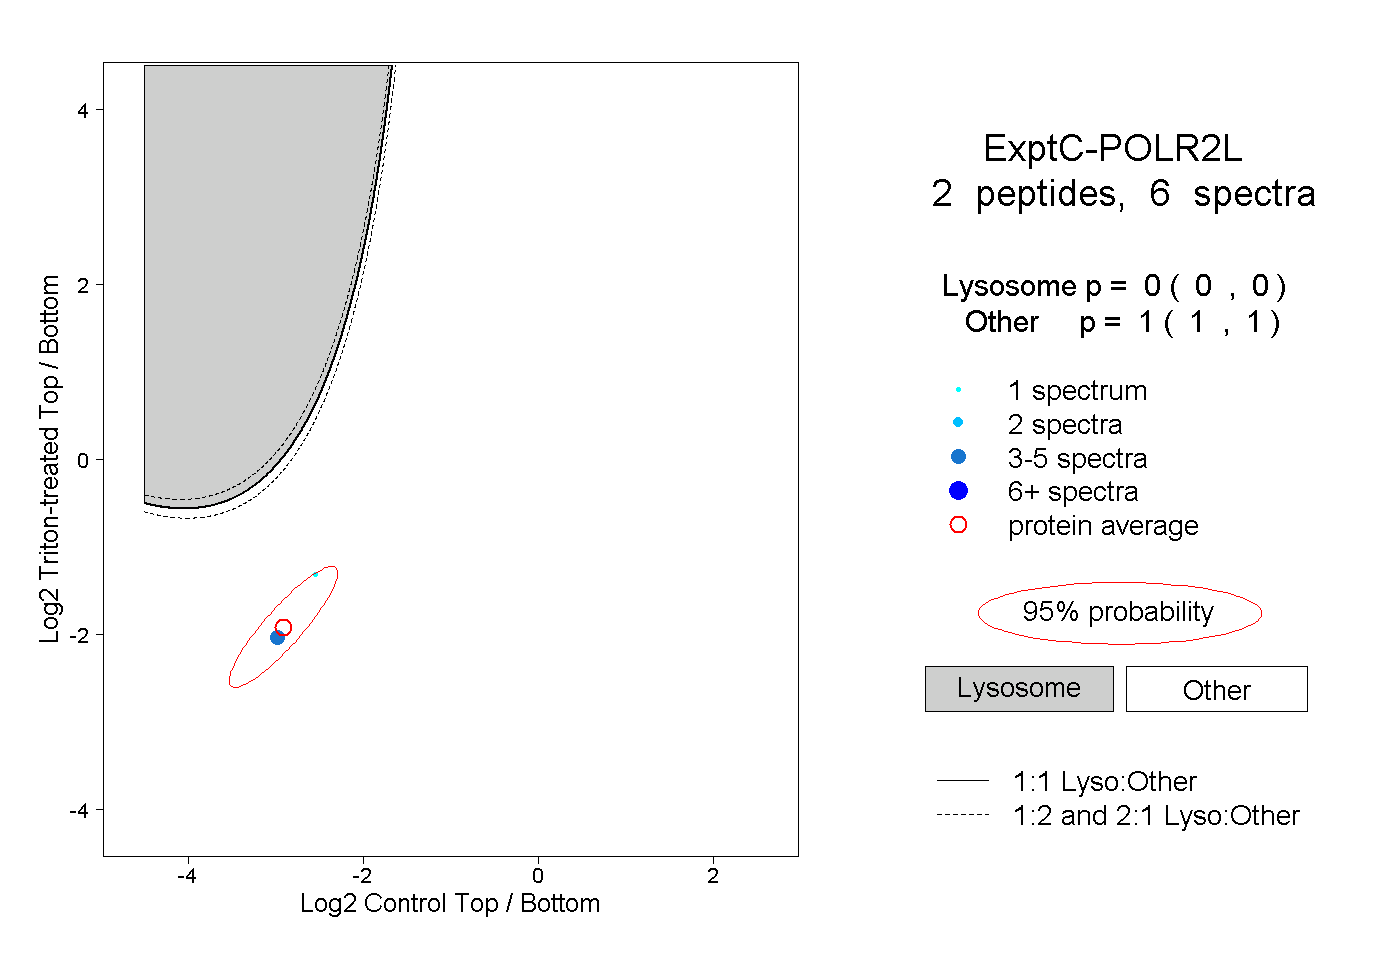 |
0.000 0.000 | 0.000 |
1.000 1.000 | 1.000 |