 12
12peptides
spectra
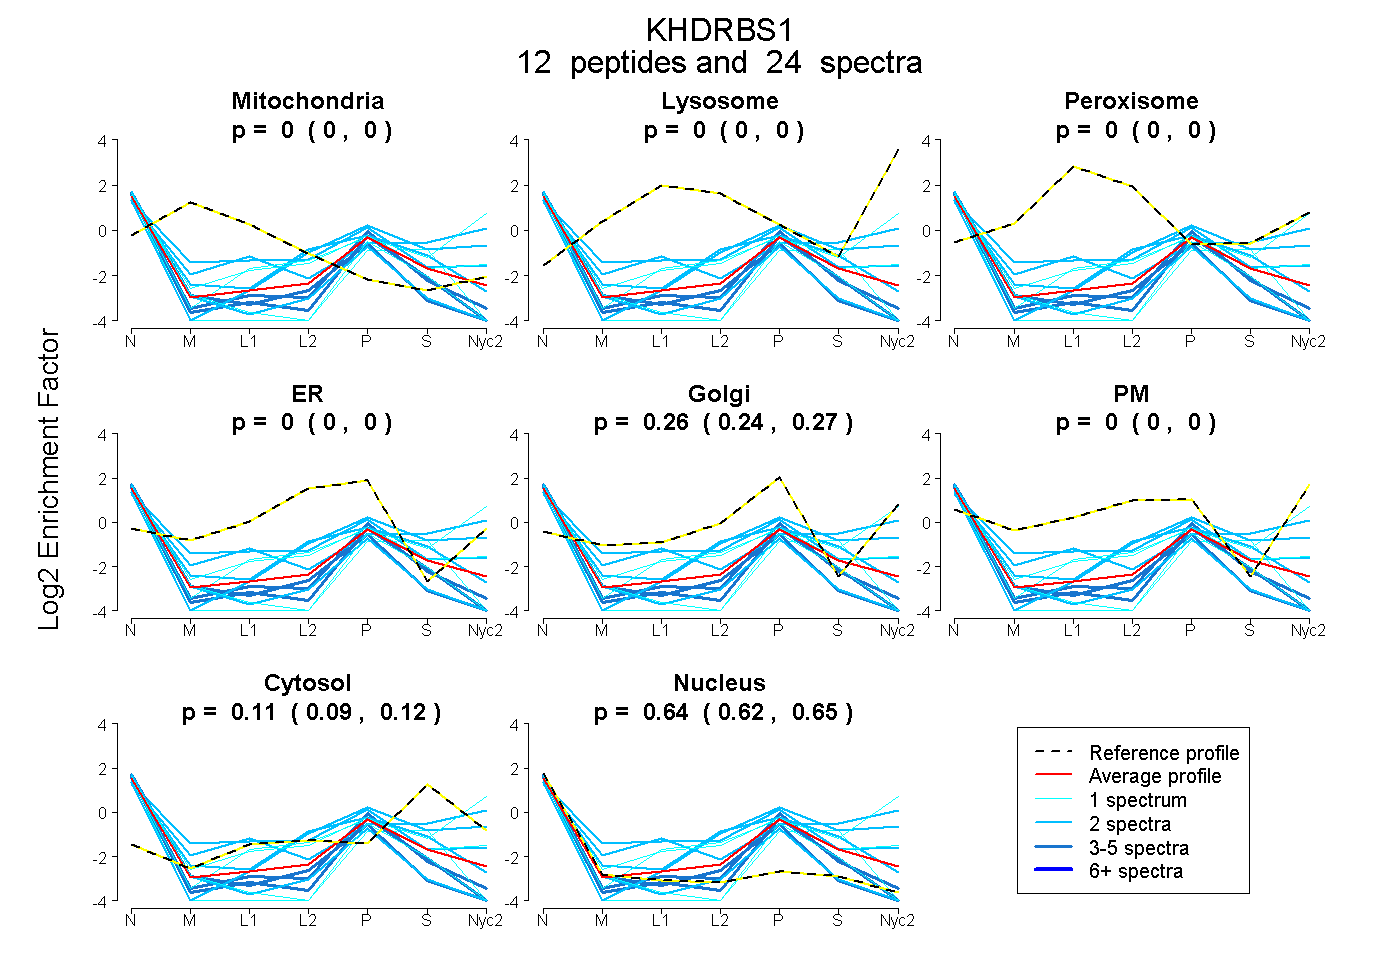
0.000 | 0.000
0.000 | 0.000
0.000 | 0.000
0.000 | 0.000
0.238 | 0.271
0.000 | 0.000
0.091 | 0.124
0.618 | 0.652
| Plot | Mito | Lyso | Perox | ER | Golgi | PM | Cytosol | Nucleus | |||||
| Expt A |
12 peptides |
24 spectra |
|
0.000 0.000 | 0.000 |
0.000 0.000 | 0.000 |
0.000 0.000 | 0.000 |
0.000 0.000 | 0.000 |
0.256 0.238 | 0.271 |
0.000 0.000 | 0.000 |
0.109 0.091 | 0.124 |
0.636 0.618 | 0.652 |
| 1 spectrum, YLPELMAEK | 0.000 | 0.000 | 0.000 | 0.000 | 0.078 | 0.000 | 0.006 | 0.915 | ||
| 2 spectra, GATVTR | 0.000 | 0.000 | 0.000 | 0.292 | 0.000 | 0.000 | 0.202 | 0.506 | ||
| 1 spectrum, MEPENK | 0.000 | 0.000 | 0.000 | 0.028 | 0.225 | 0.137 | 0.125 | 0.486 | ||
| 2 spectra, ISVLGK | 0.000 | 0.000 | 0.000 | 0.000 | 0.097 | 0.000 | 0.000 | 0.903 | ||
| 4 spectra, GVPPPPTVR | 0.000 | 0.000 | 0.000 | 0.000 | 0.102 | 0.000 | 0.021 | 0.877 | ||
| 3 spectra, APPARPVK | 0.000 | 0.000 | 0.000 | 0.000 | 0.210 | 0.000 | 0.000 | 0.790 | ||
| 1 spectrum, VLIPVK | 0.000 | 0.000 | 0.000 | 0.000 | 0.054 | 0.372 | 0.282 | 0.292 | ||
| 2 spectra, GAPTPR | 0.000 | 0.000 | 0.000 | 0.000 | 0.000 | 0.349 | 0.375 | 0.276 | ||
| 2 spectra, ILGPQGNTIK | 0.000 | 0.000 | 0.000 | 0.000 | 0.355 | 0.000 | 0.306 | 0.339 | ||
| 1 spectrum, DSLDPSFTHAMQLLSVEIEK | 0.000 | 0.000 | 0.000 | 0.000 | 0.000 | 0.000 | 0.164 | 0.836 | ||
| 2 spectra, EHPYGR | 0.000 | 0.000 | 0.063 | 0.129 | 0.238 | 0.081 | 0.059 | 0.430 | ||
| 3 spectra, FNFVGK | 0.000 | 0.000 | 0.000 | 0.111 | 0.029 | 0.000 | 0.000 | 0.860 |
| Plot | Mito | Lyso or Perox | ER | Golgi | PM | Cytosol | Nucleus | ||||||
| Expt B |
1 peptide |
2 spectra |
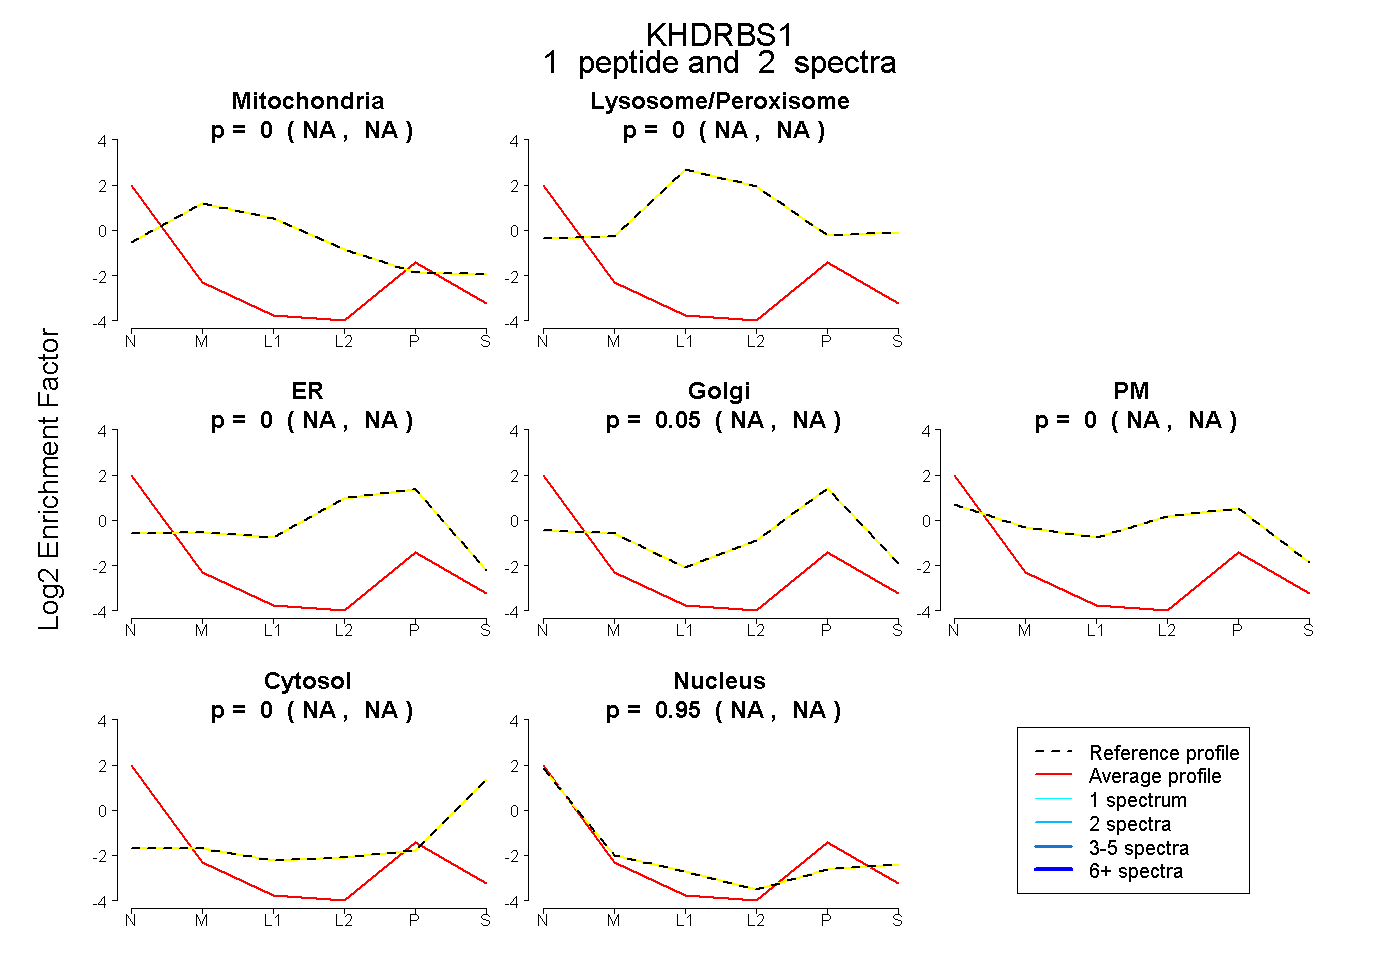 |
0.000 NA | NA |
0.000 NA | NA |
0.000 NA | NA |
0.052 NA | NA |
0.000 NA | NA |
0.000 NA | NA |
0.948 NA | NA |
|||
| Plot | Lyso | Other | |||||||||||
| Expt C |
5 peptides |
12 spectra |
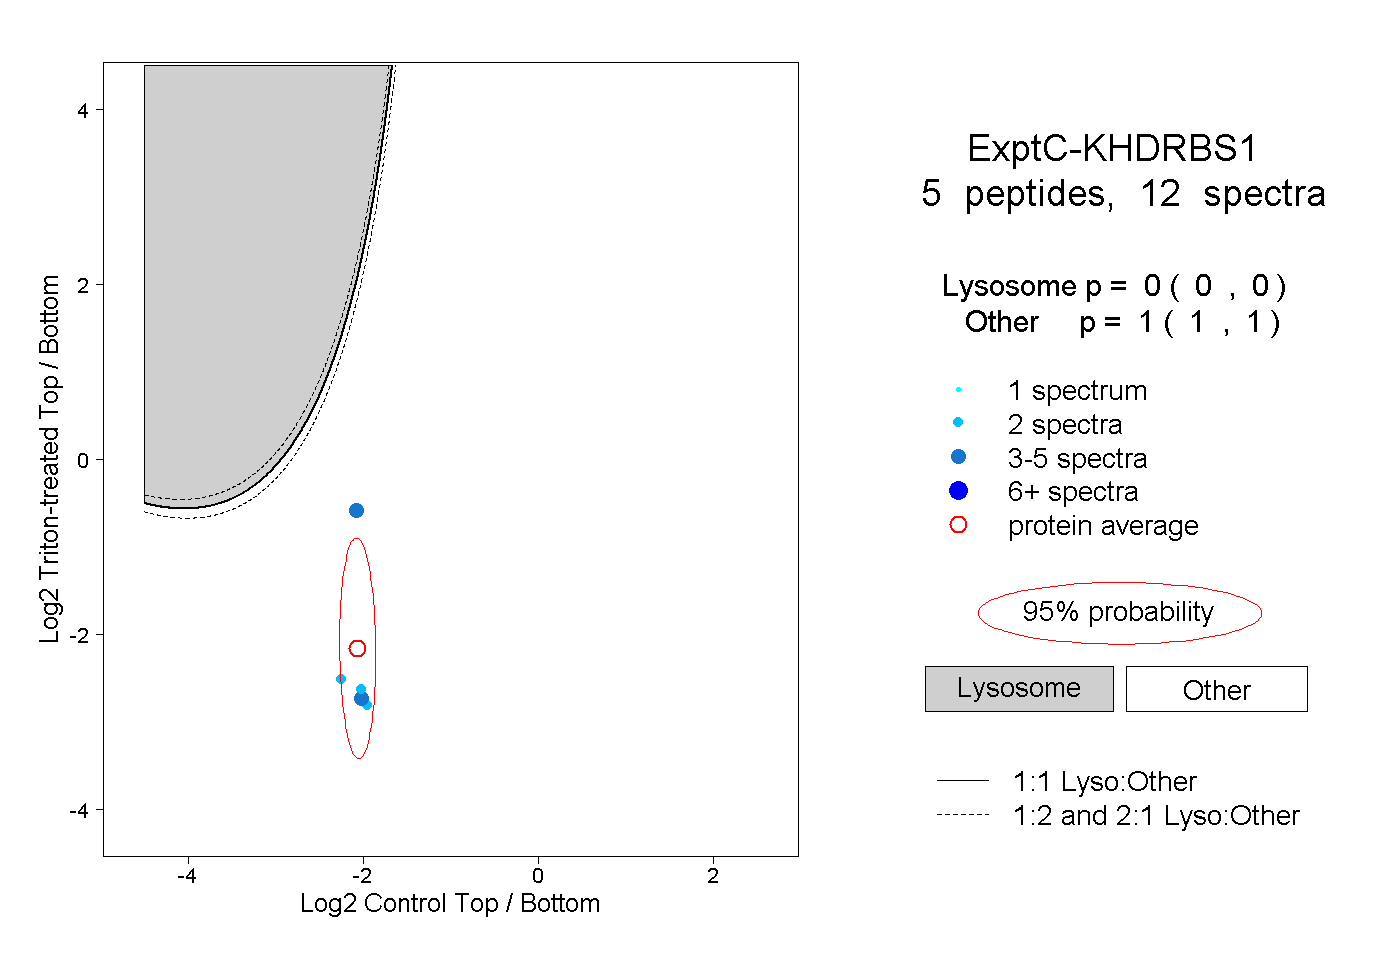 |
0.000 0.000 | 0.000 |
1.000 1.000 | 1.000 |