 1
1peptide
spectrum
NA | NA
NA | NA
NA | NA
NA | NA
NA | NA
NA | NA
NA | NA
NA | NA
2peptides
spectra
0.000 | 0.722
0.274 | 1.000
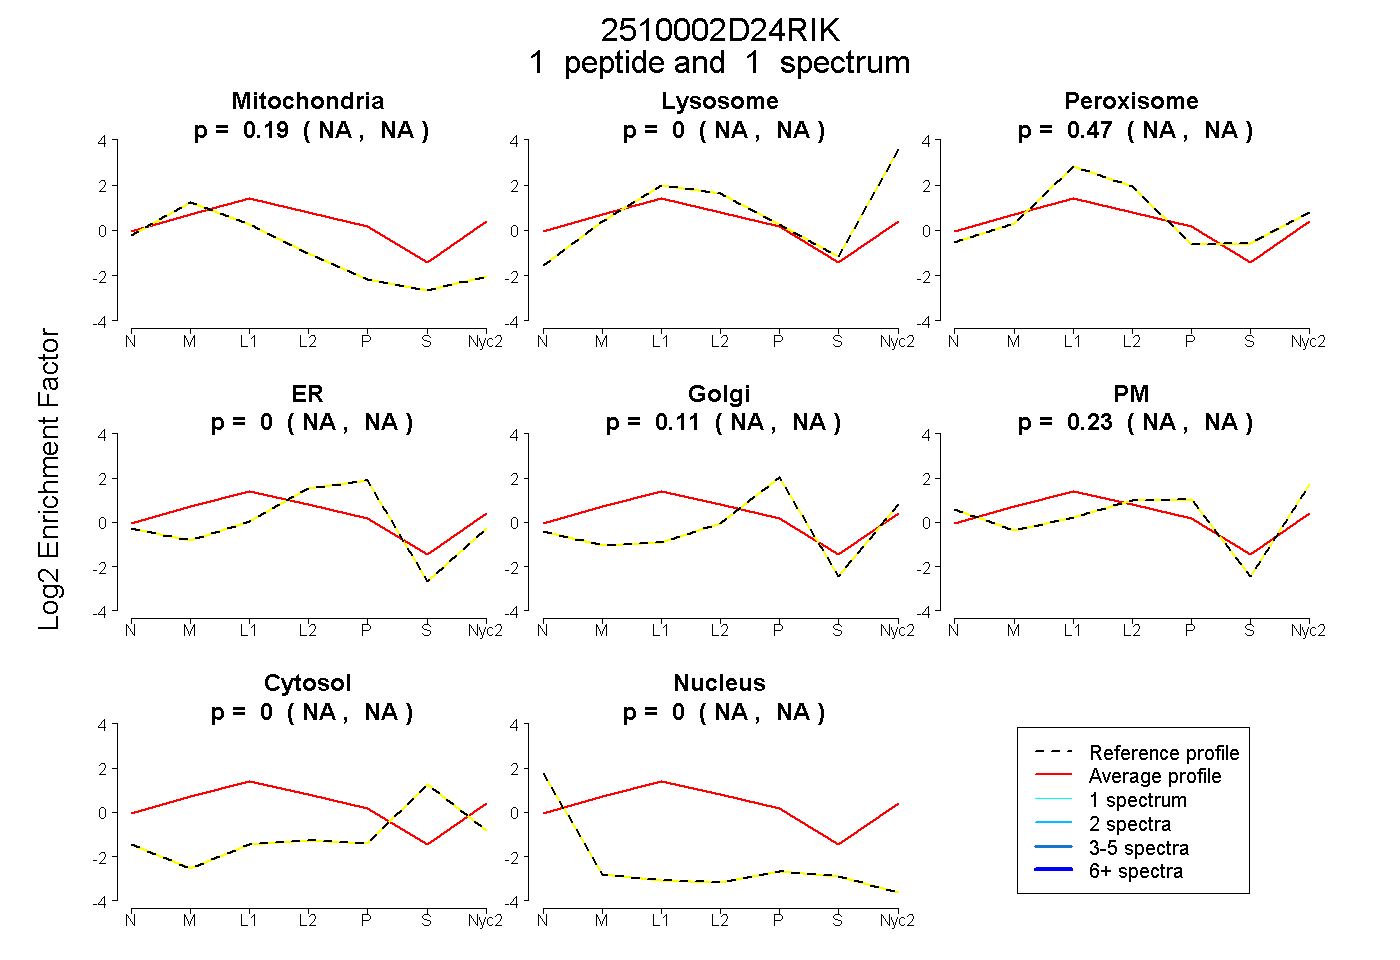
| Plot | Mito | Lyso | Perox | ER | Golgi | PM | Cytosol | Nucleus | |||||
| Expt A |
1 peptide |
1 spectrum |
|
0.188 NA | NA |
0.000 NA | NA |
0.468 NA | NA |
0.000 NA | NA |
0.110 NA | NA |
0.233 NA | NA |
0.000 NA | NA |
0.000 NA | NA |
||
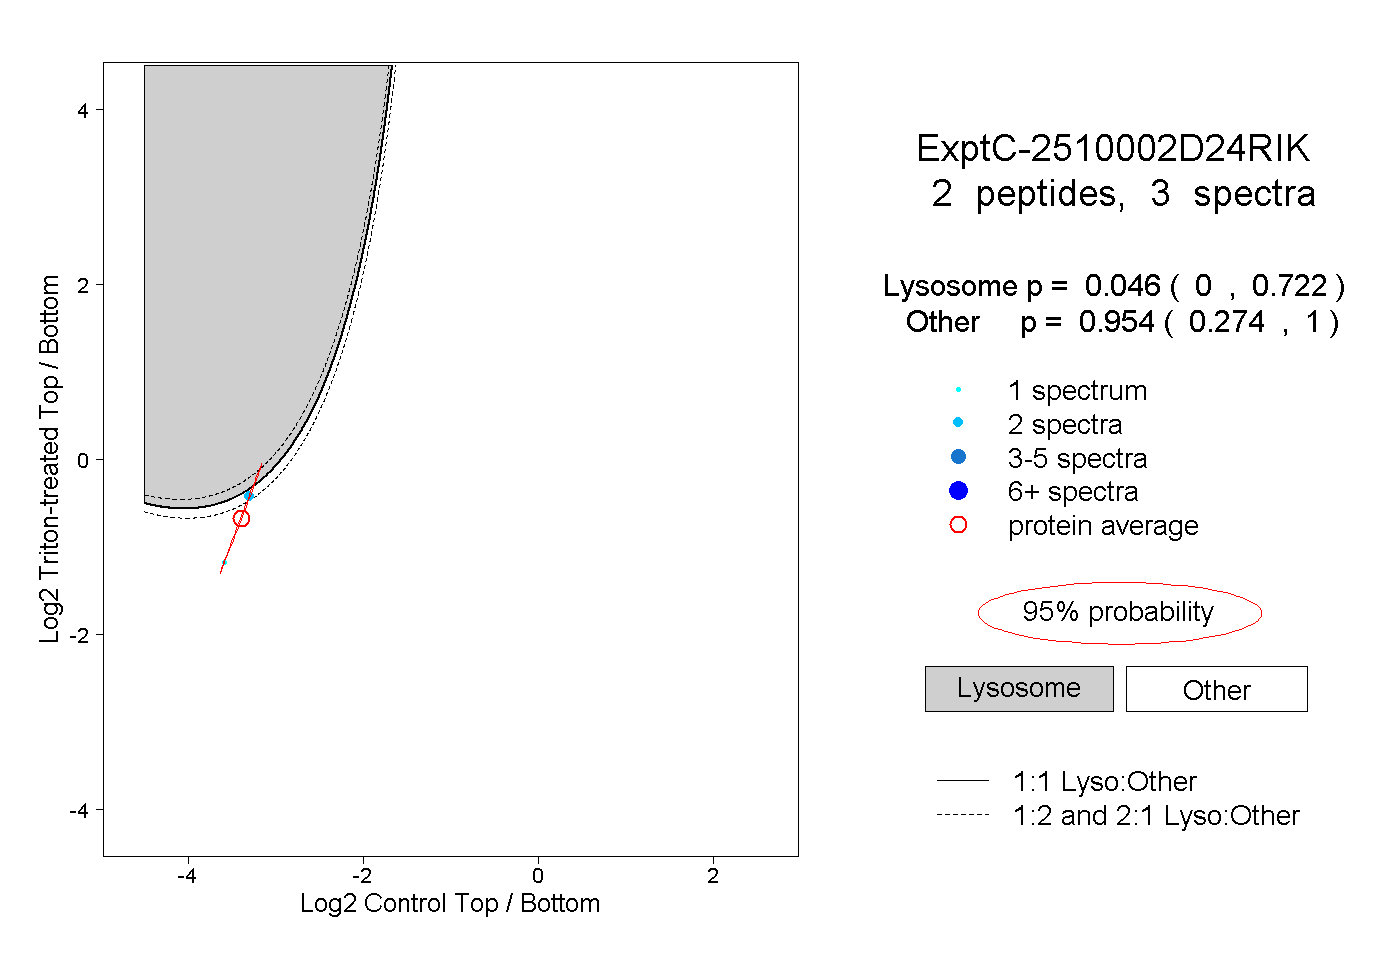
| Plot | Lyso | Other | |||||||||||
| Expt C |
2 peptides |
3 spectra |
|
0.046 0.000 | 0.722 |
0.954 0.274 | 1.000 |
| 2 spectra, SLCESEQTR | 0.287 | 0.713 | ||||||||
| 1 spectrum, VQAAQK | 0.000 | 1.000 |