 3
3peptides
spectra
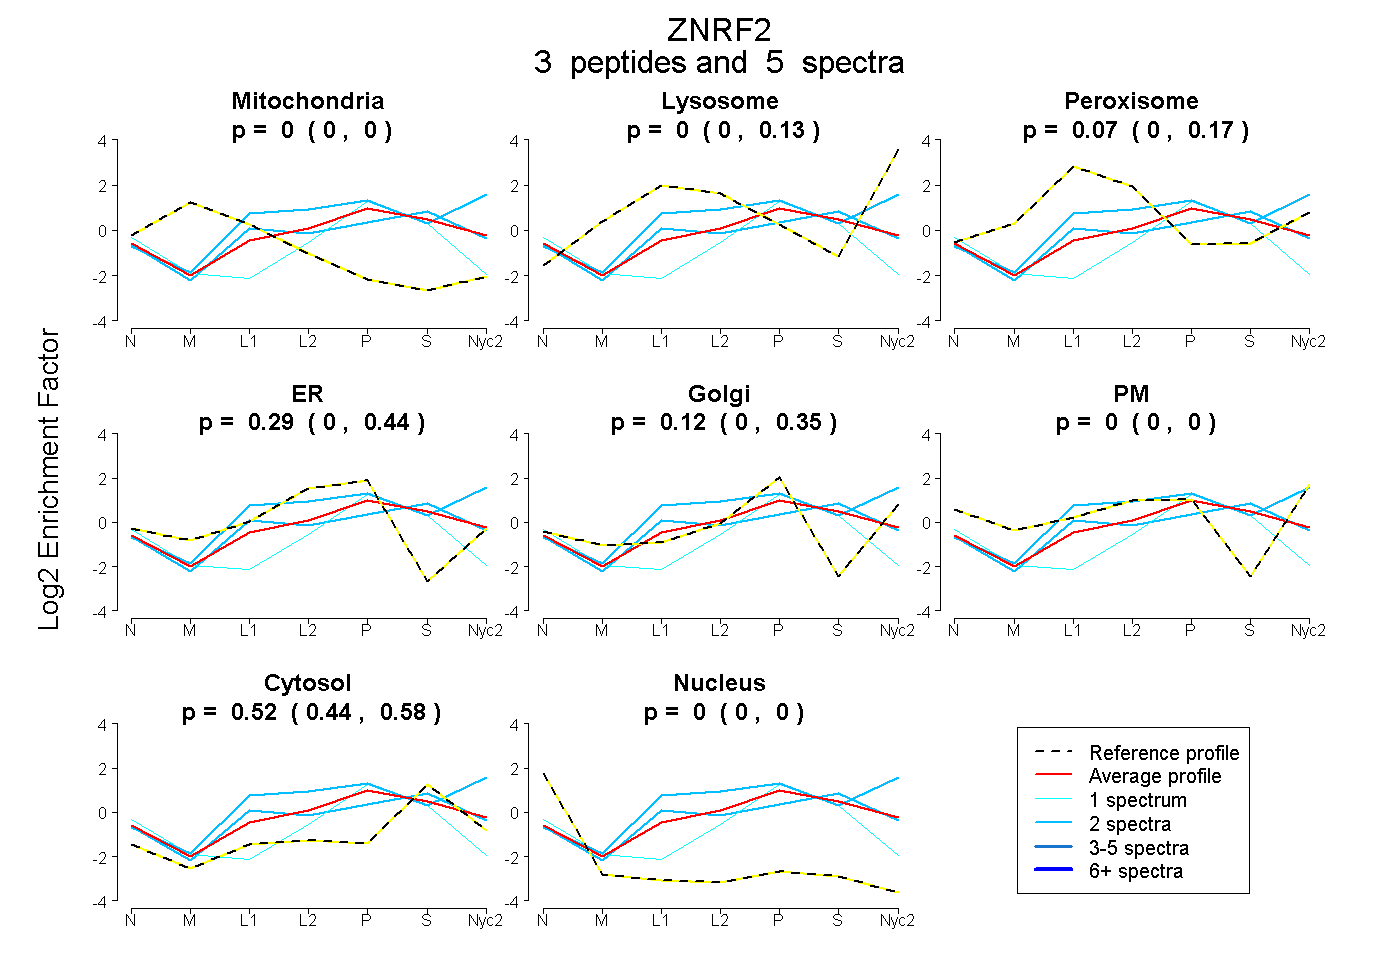
0.000 | 0.000
0.000 | 0.128
0.000 | 0.173
0.000 | 0.442
0.000 | 0.349
0.000 | 0.000
0.441 | 0.578
0.000 | 0.000
| Plot | Mito | Lyso | Perox | ER | Golgi | PM | Cytosol | Nucleus | |||||
| Expt A |
3 peptides |
5 spectra |
|
0.000 0.000 | 0.000 |
0.000 0.000 | 0.128 |
0.066 0.000 | 0.173 |
0.291 0.000 | 0.442 |
0.124 0.000 | 0.349 |
0.000 0.000 | 0.000 |
0.519 0.441 | 0.578 |
0.000 0.000 | 0.000 |
| 2 spectra, SLGGAVGSAASGR | 0.000 | 0.426 | 0.000 | 0.194 | 0.068 | 0.000 | 0.313 | 0.000 | ||
| 2 spectra, GCIDEWFEVNR | 0.000 | 0.000 | 0.179 | 0.202 | 0.019 | 0.000 | 0.600 | 0.000 | ||
| 1 spectrum, LPCLCIYHK | 0.000 | 0.000 | 0.000 | 0.277 | 0.093 | 0.000 | 0.520 | 0.110 |
| Plot | Lyso | Other | |||||||||||
| Expt C |
1 peptide |
2 spectra |
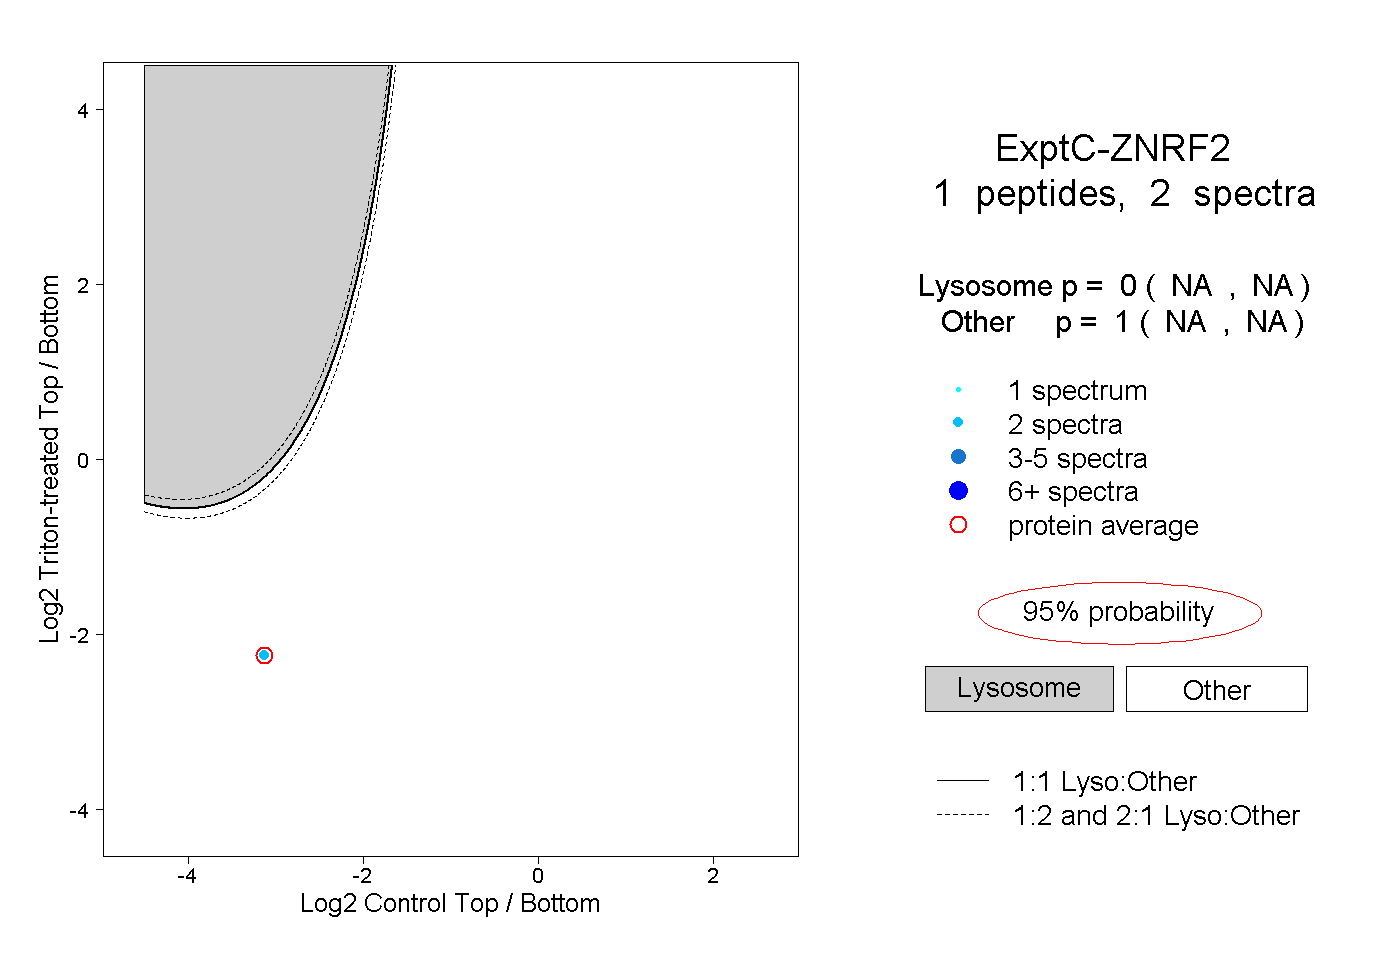 |
0.000 NA | NA |
1.000 NA | NA |