 1
1peptide
spectrum
NA | NA
NA | NA
NA | NA
NA | NA
NA | NA
NA | NA
NA | NA
NA | NA
3peptides
spectra
0.000 | 0.953
0.047 | 1.000
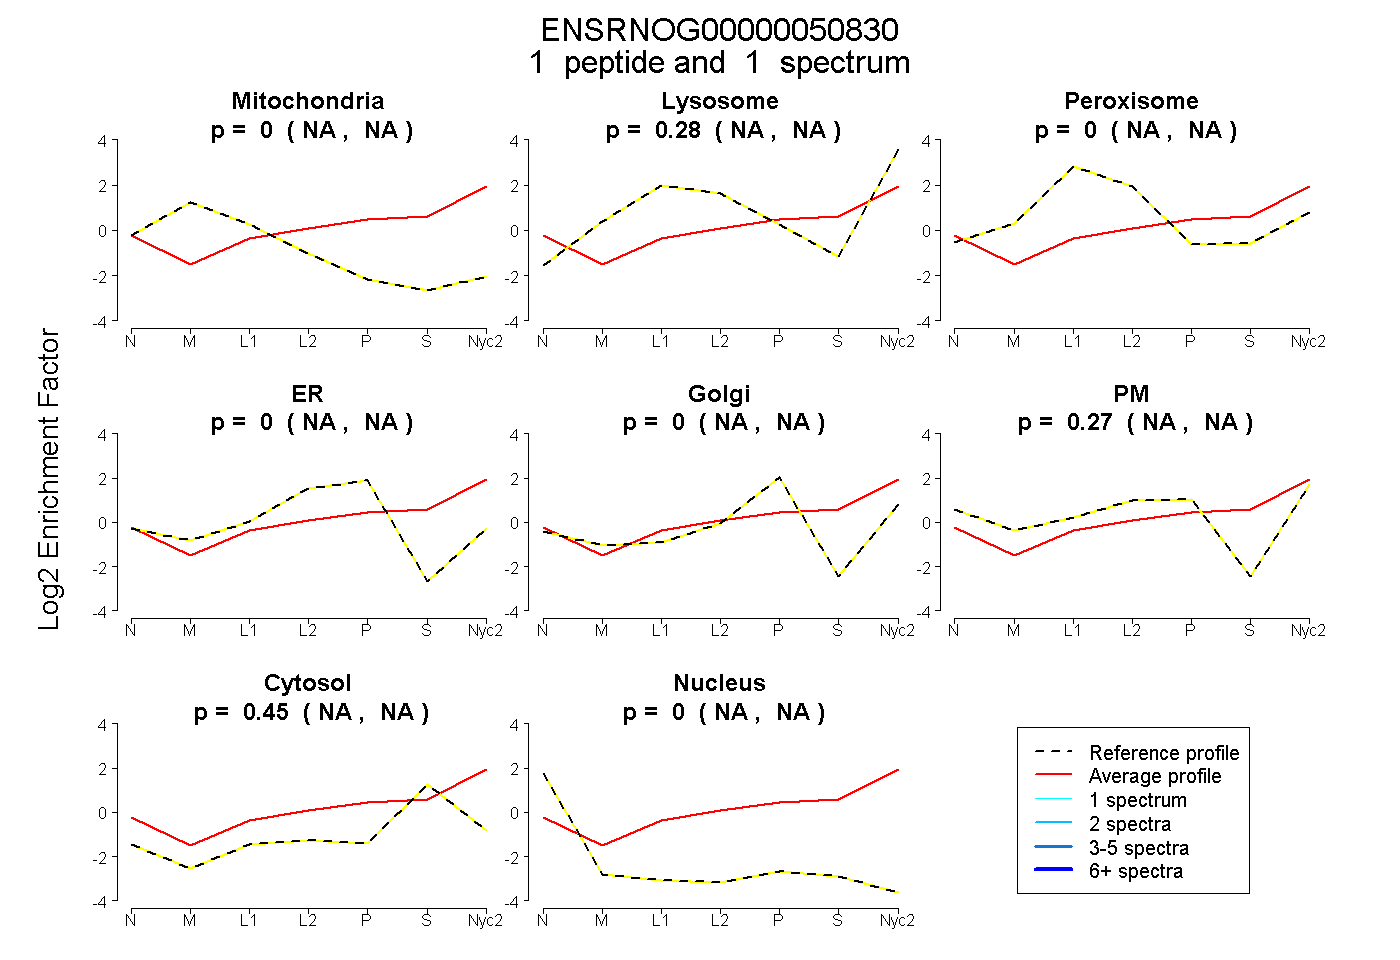
| Plot | Mito | Lyso | Perox | ER | Golgi | PM | Cytosol | Nucleus | |||||
| Expt A |
1 peptide |
1 spectrum |
|
0.000 NA | NA |
0.282 NA | NA |
0.000 NA | NA |
0.000 NA | NA |
0.000 NA | NA |
0.270 NA | NA |
0.448 NA | NA |
0.000 NA | NA |
||
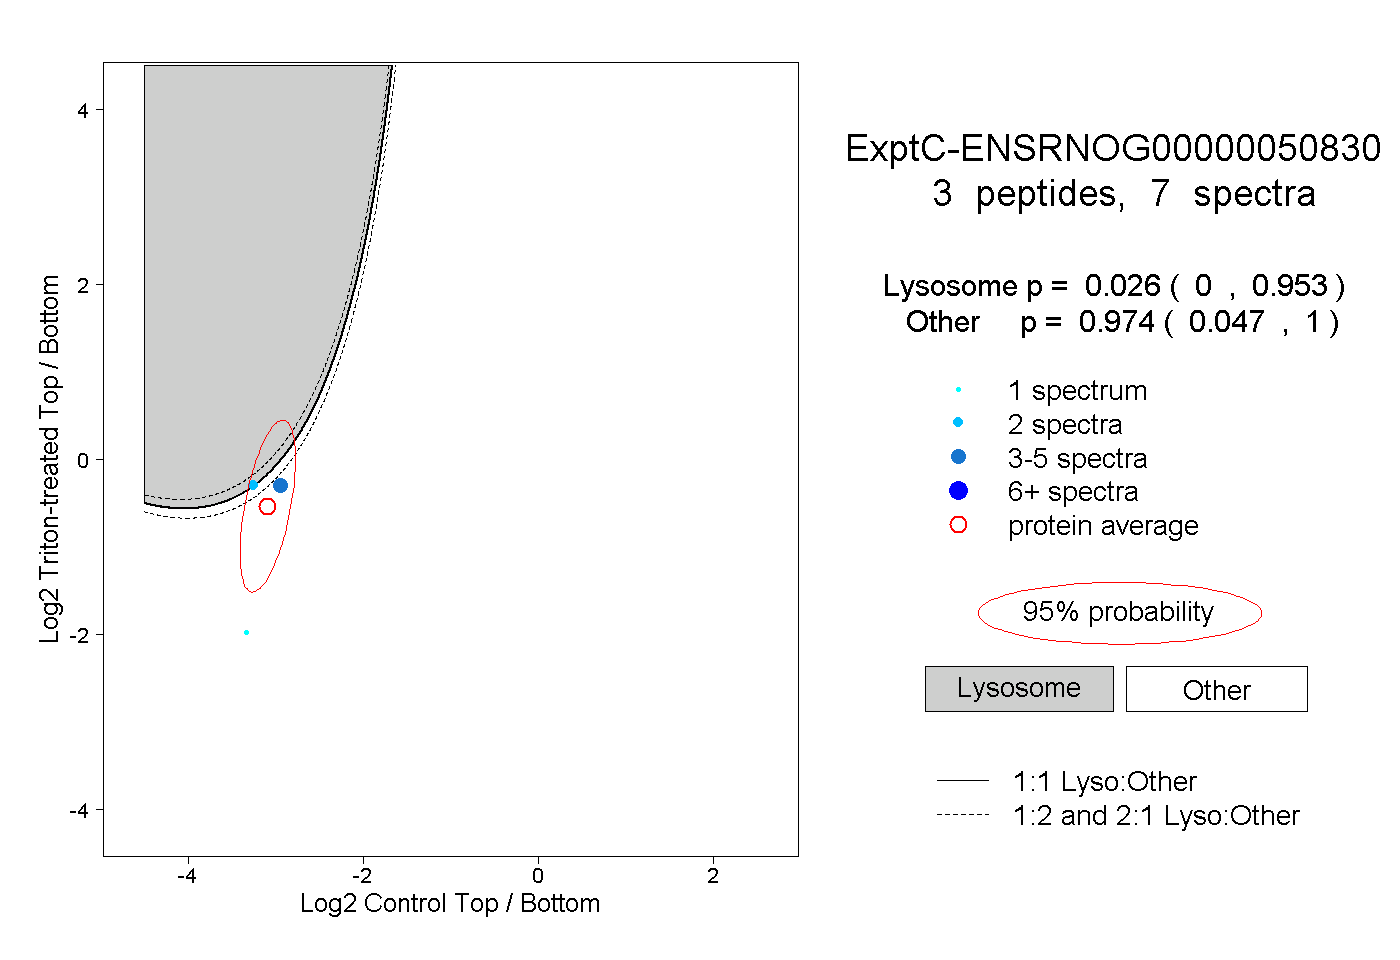
| Plot | Lyso | Other | |||||||||||
| Expt C |
3 peptides |
7 spectra |
|
0.026 0.000 | 0.953 |
0.974 0.047 | 1.000 |