 8
8peptides
spectra
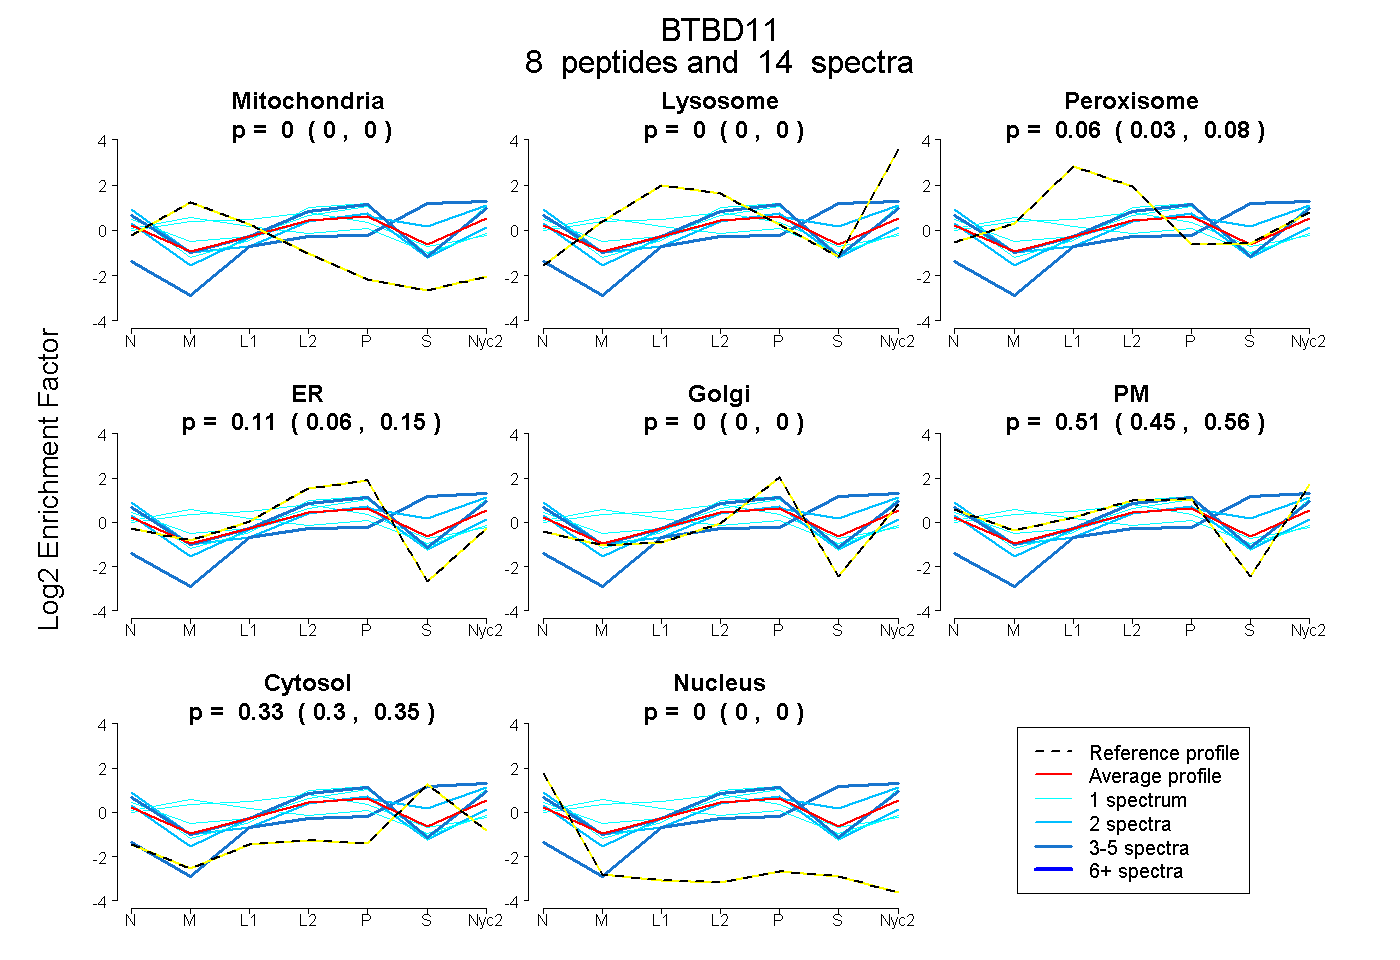
0.000 | 0.000
0.000 | 0.000
0.029 | 0.081
0.057 | 0.148
0.000 | 0.000
0.453 | 0.555
0.304 | 0.345
0.000 | 0.000
1peptide
spectrum
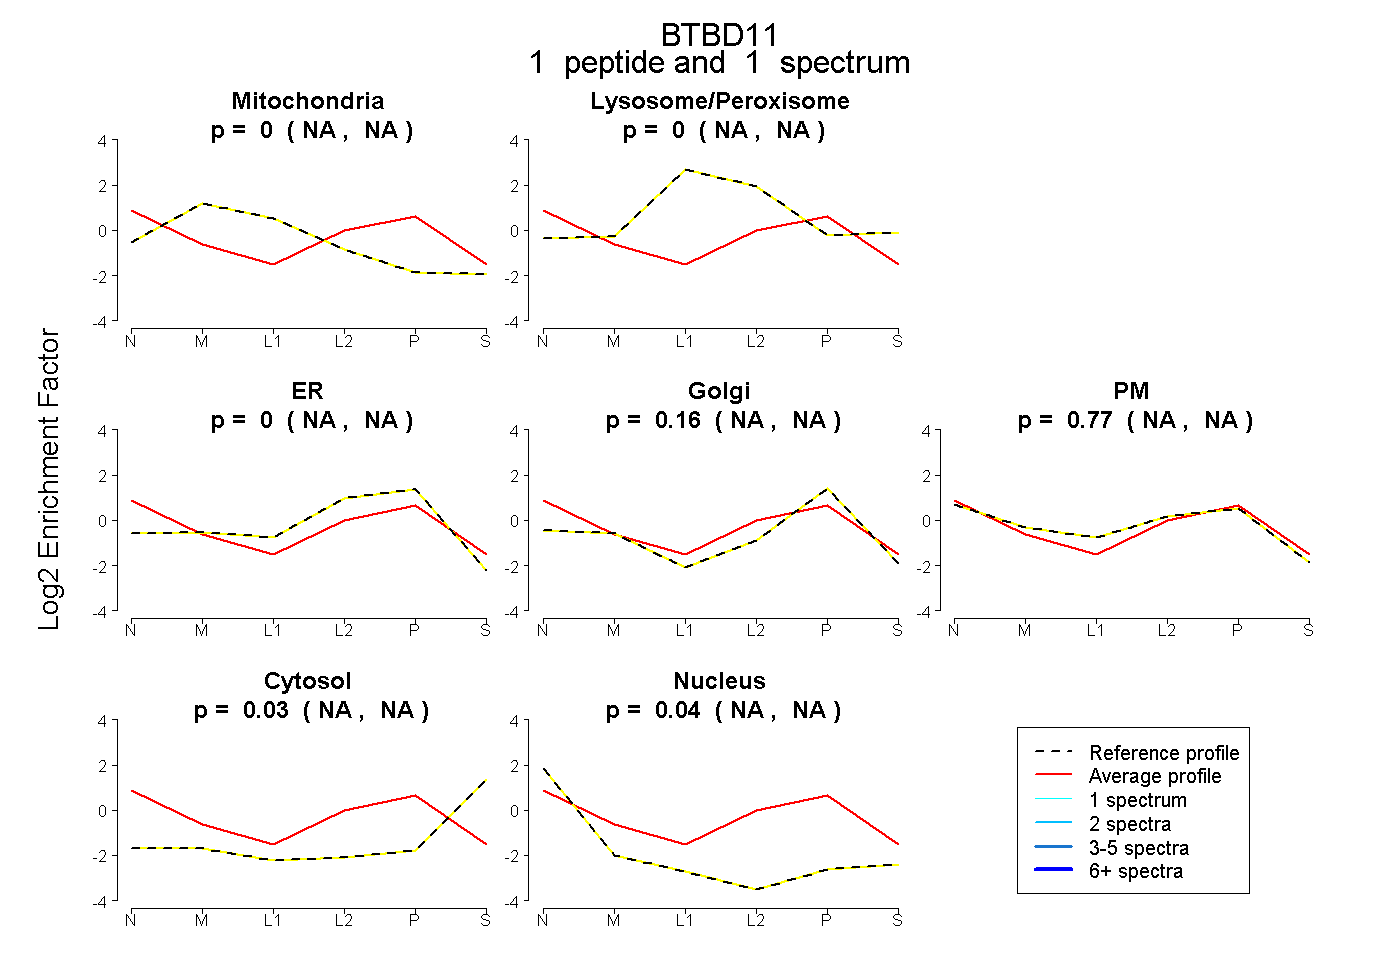
NA | NA
NA | NA
NA | NA
NA | NA
NA | NA
NA | NA
NA | NA
1peptide
spectrum
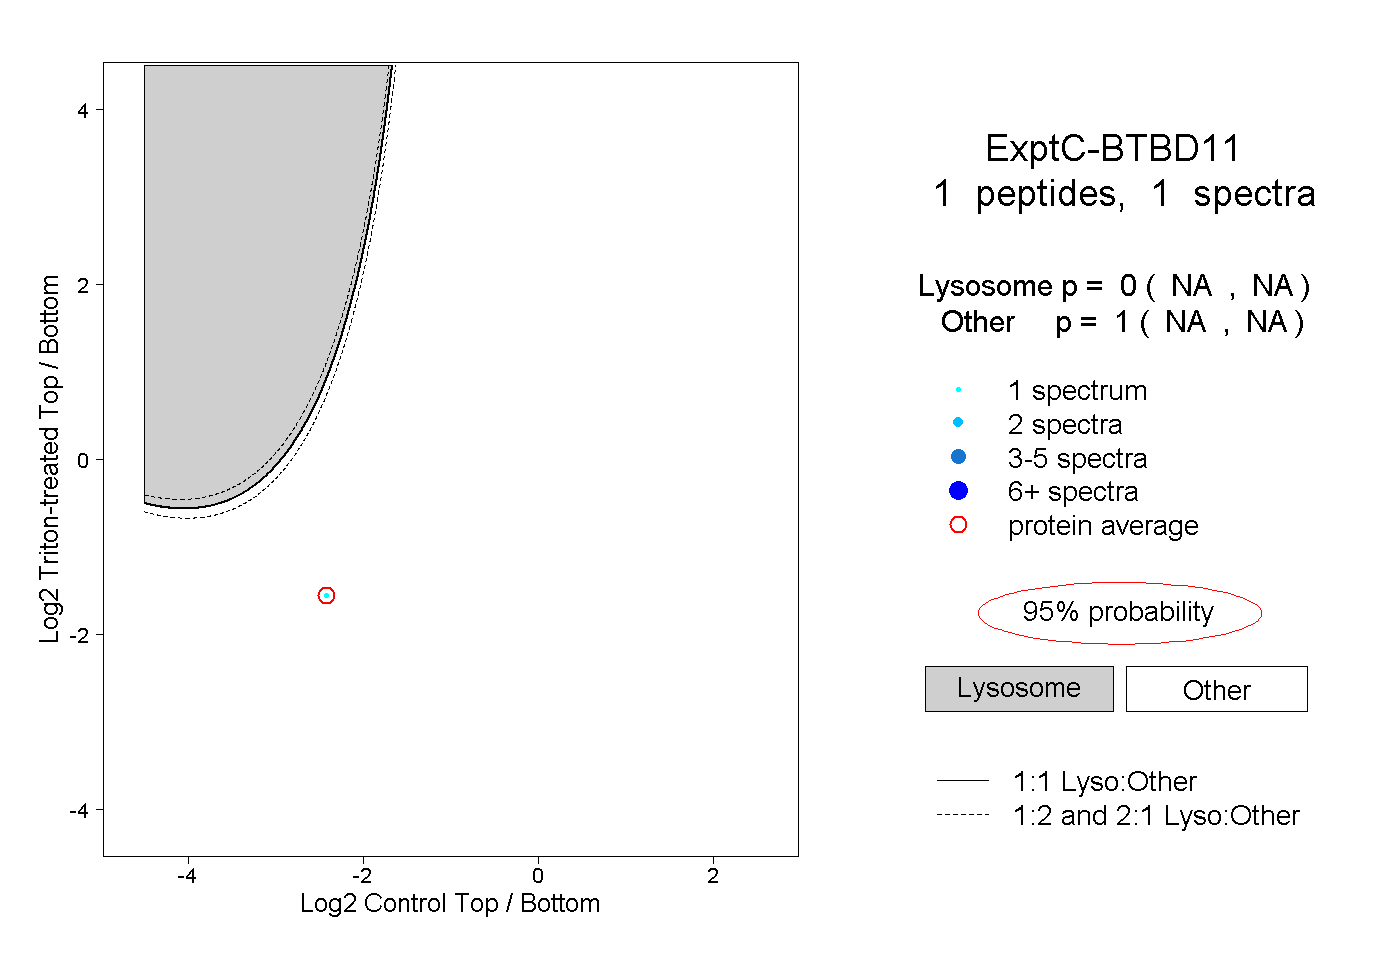
NA | NA
NA | NA