 1
1peptide
spectra
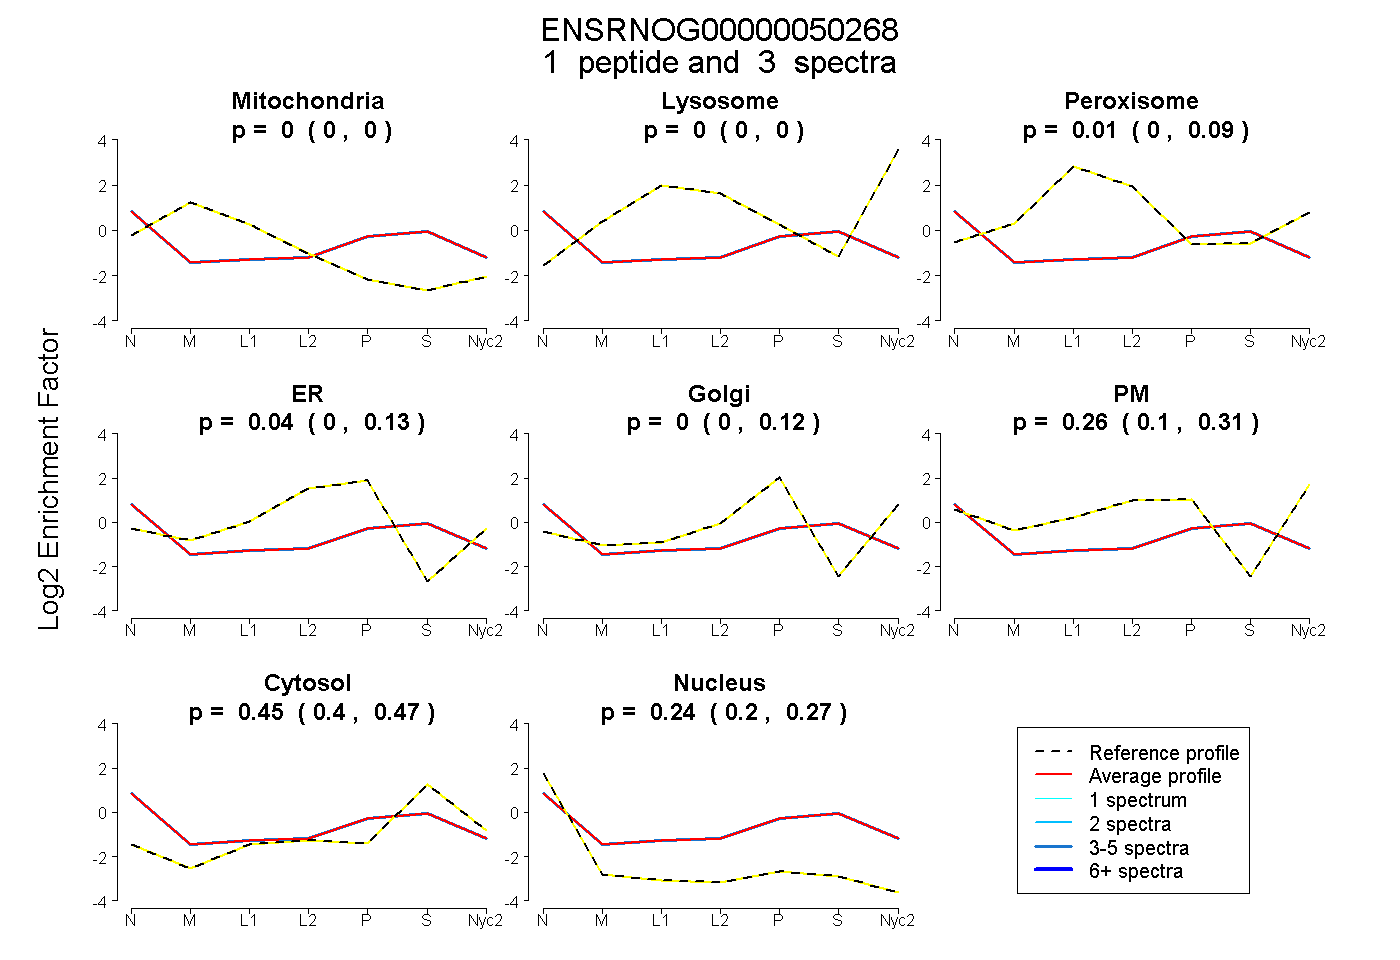
0.000 | 0.000
0.000 | 0.000
0.000 | 0.085
0.000 | 0.132
0.000 | 0.116
0.095 | 0.311
0.400 | 0.473
0.201 | 0.272
3peptides
spectra
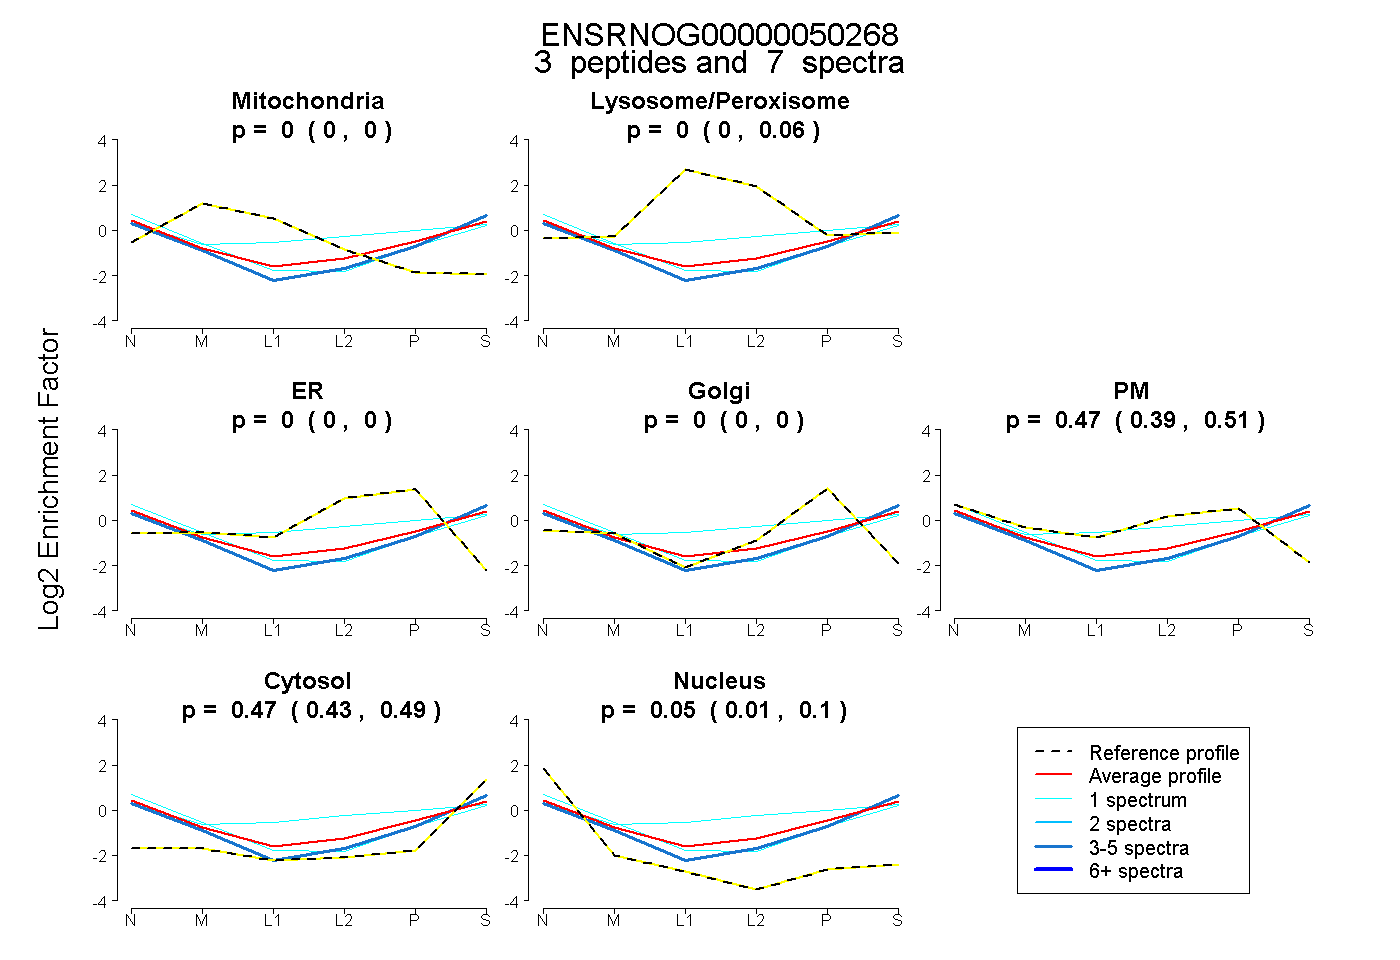
0.000 | 0.000
0.000 | 0.063
0.000 | 0.000
0.000 | 0.000
0.387 | 0.507
0.431 | 0.491
0.014 | 0.103
1peptide
spectra
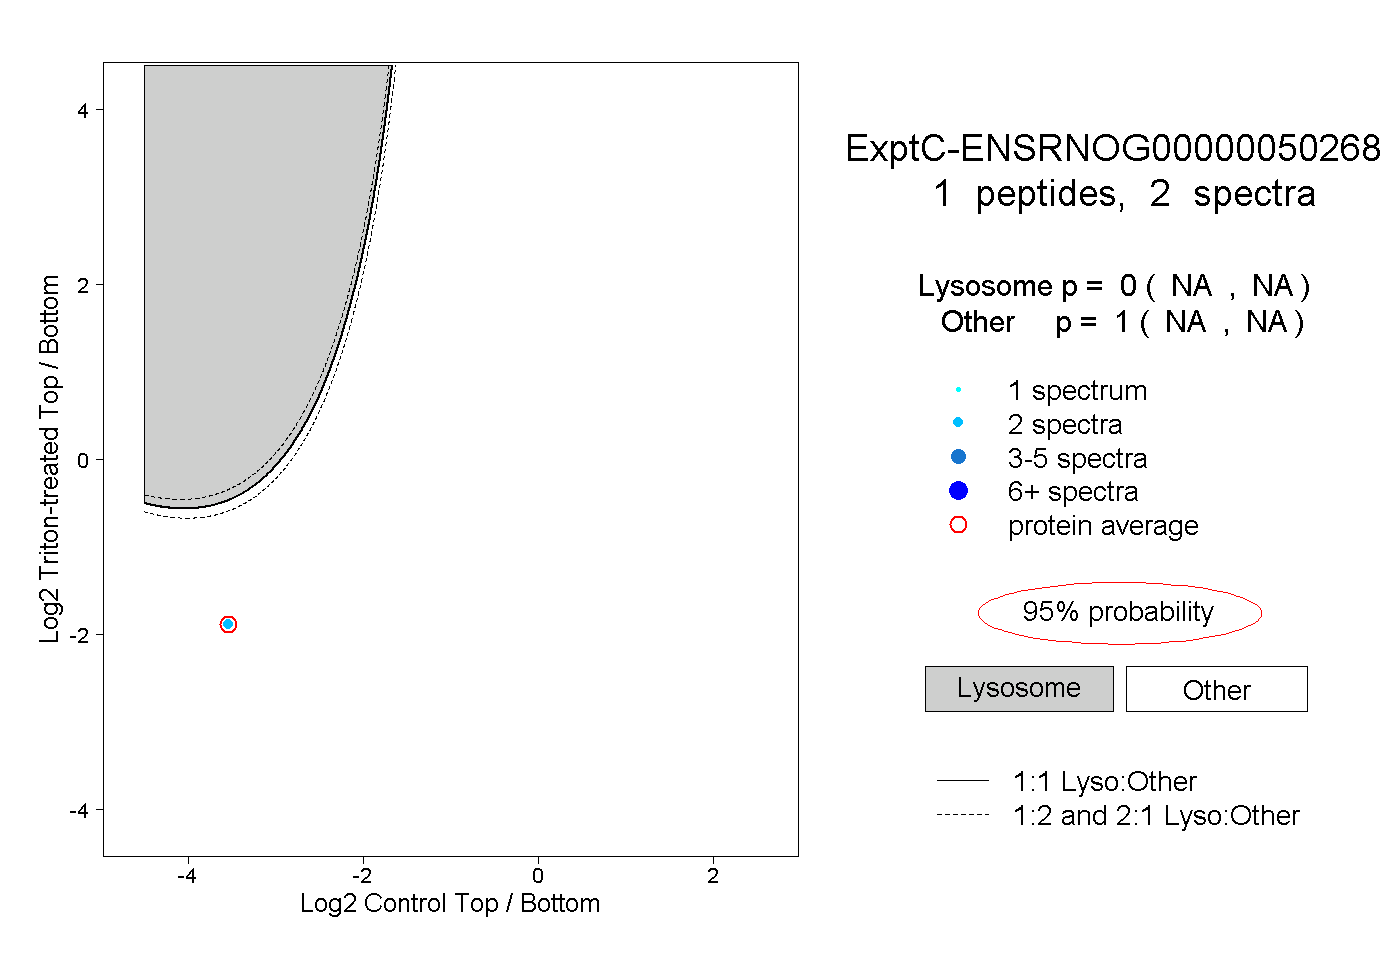
NA | NA
NA | NA