 2
2peptides
spectra
0.000 | 0.000
0.418 | 0.540
0.000 | 0.000
0.170 | 0.349
0.000 | 0.079
0.099 | 0.326
0.000 | 0.000
0.000 | 0.000
2peptides
spectra
0.359 | 1.000
0.000 | 0.630
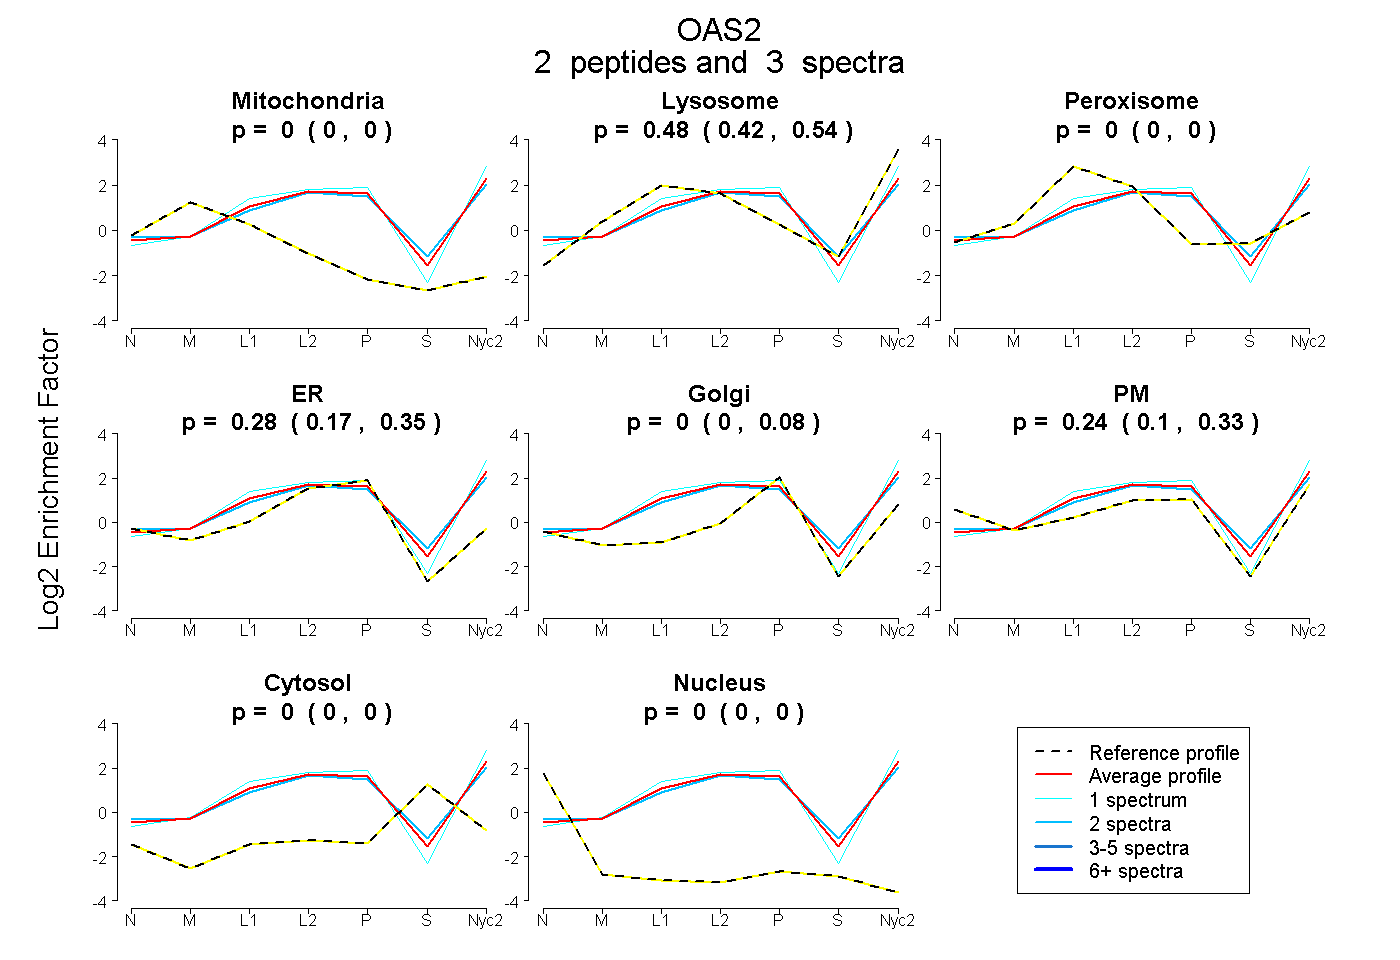
| Plot | Mito | Lyso | Perox | ER | Golgi | PM | Cytosol | Nucleus | |||||
| Expt A |
2 peptides |
3 spectra |
|
0.000 0.000 | 0.000 |
0.481 0.418 | 0.540 |
0.000 0.000 | 0.000 |
0.278 0.170 | 0.349 |
0.003 0.000 | 0.079 |
0.238 0.099 | 0.326 |
0.000 0.000 | 0.000 |
0.000 0.000 | 0.000 |
||
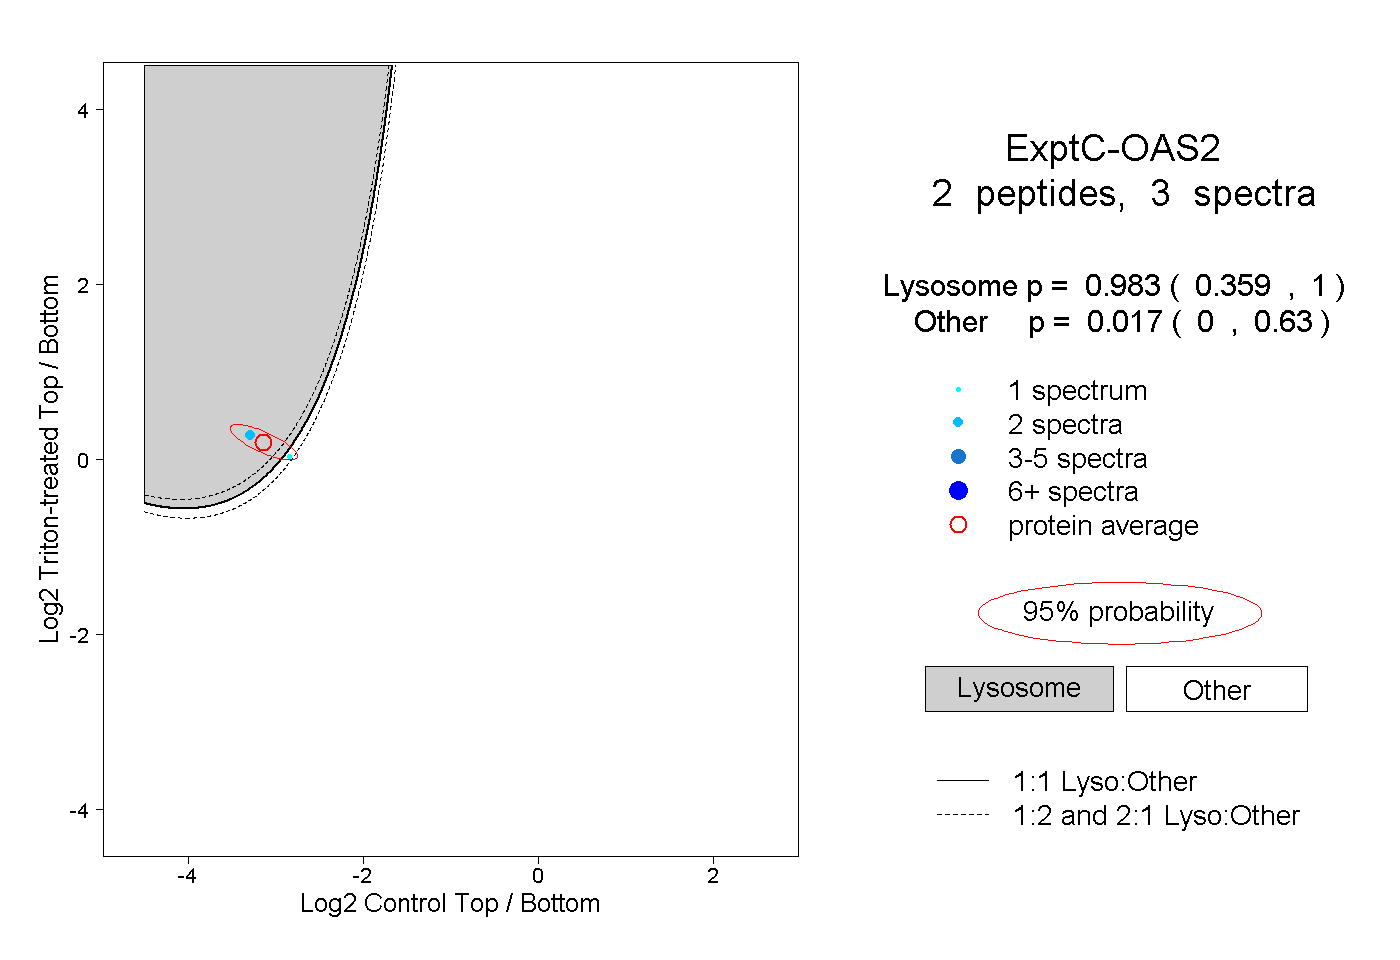
| Plot | Lyso | Other | |||||||||||
| Expt C |
2 peptides |
3 spectra |
|
0.983 0.359 | 1.000 |
0.017 0.000 | 0.630 |