 1
1peptide
spectrum
NA | NA
NA | NA
NA | NA
NA | NA
NA | NA
NA | NA
NA | NA
NA | NA
| Plot | Mito | Lyso | Perox | ER | Golgi | PM | Cytosol | Nucleus | |||||
| Expt A |
1 peptide |
1 spectrum |
|
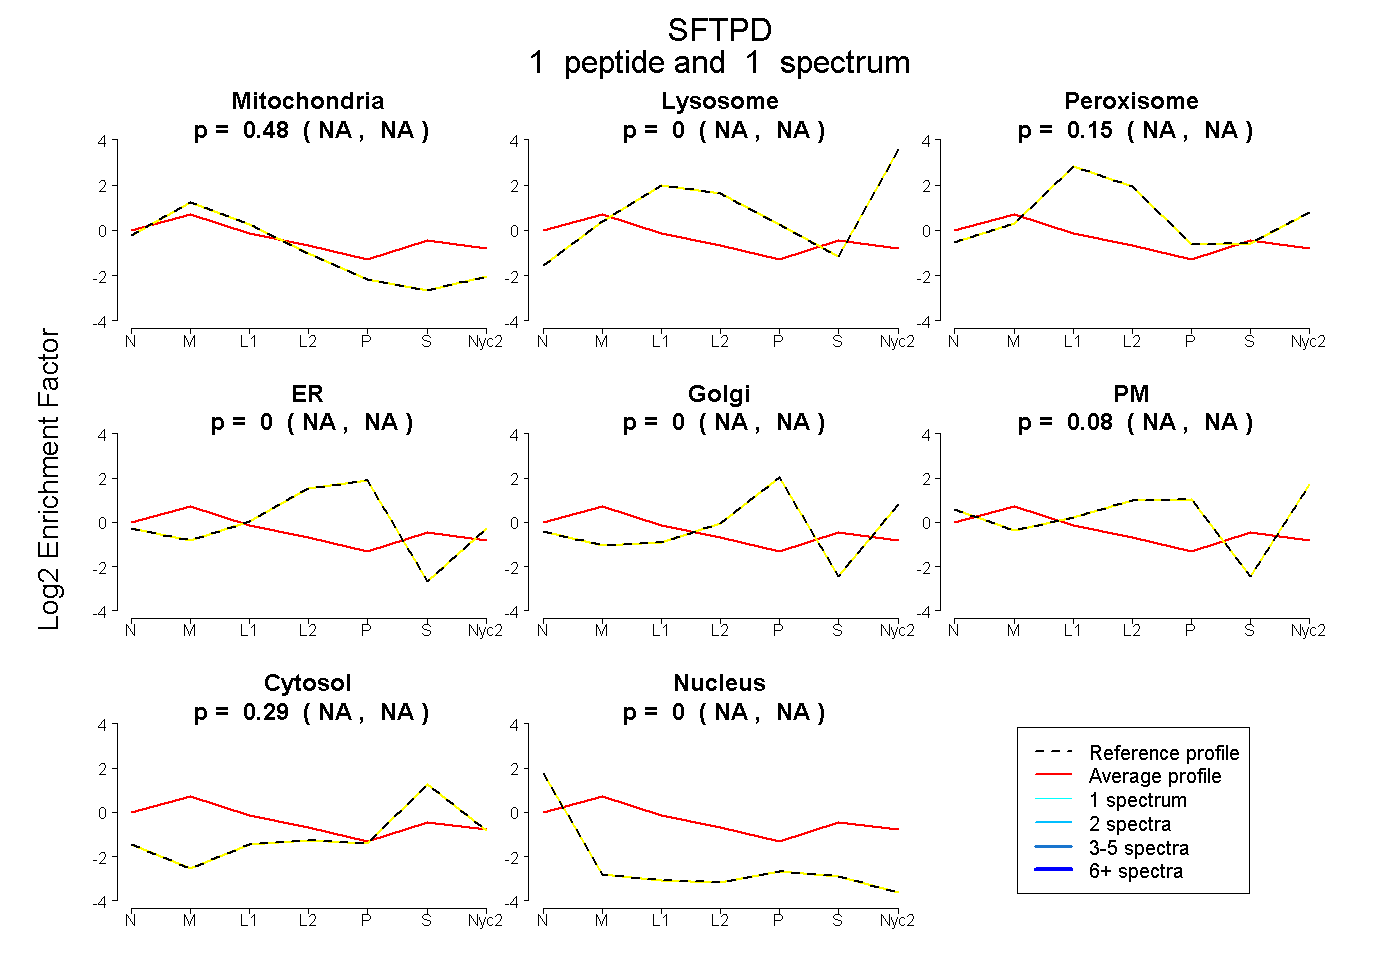
0.482 NA | NA |
0.002 NA | NA |
0.148 NA | NA |
0.000 NA | NA |
0.000 NA | NA |
0.081 NA | NA |
0.287 NA | NA |
0.000 NA | NA |
| 1 spectrum, AAFLSMTDVGTEGK | 0.482 | 0.002 | 0.148 | 0.000 | 0.000 | 0.081 | 0.287 | 0.000 |