10
10peptides
spectra
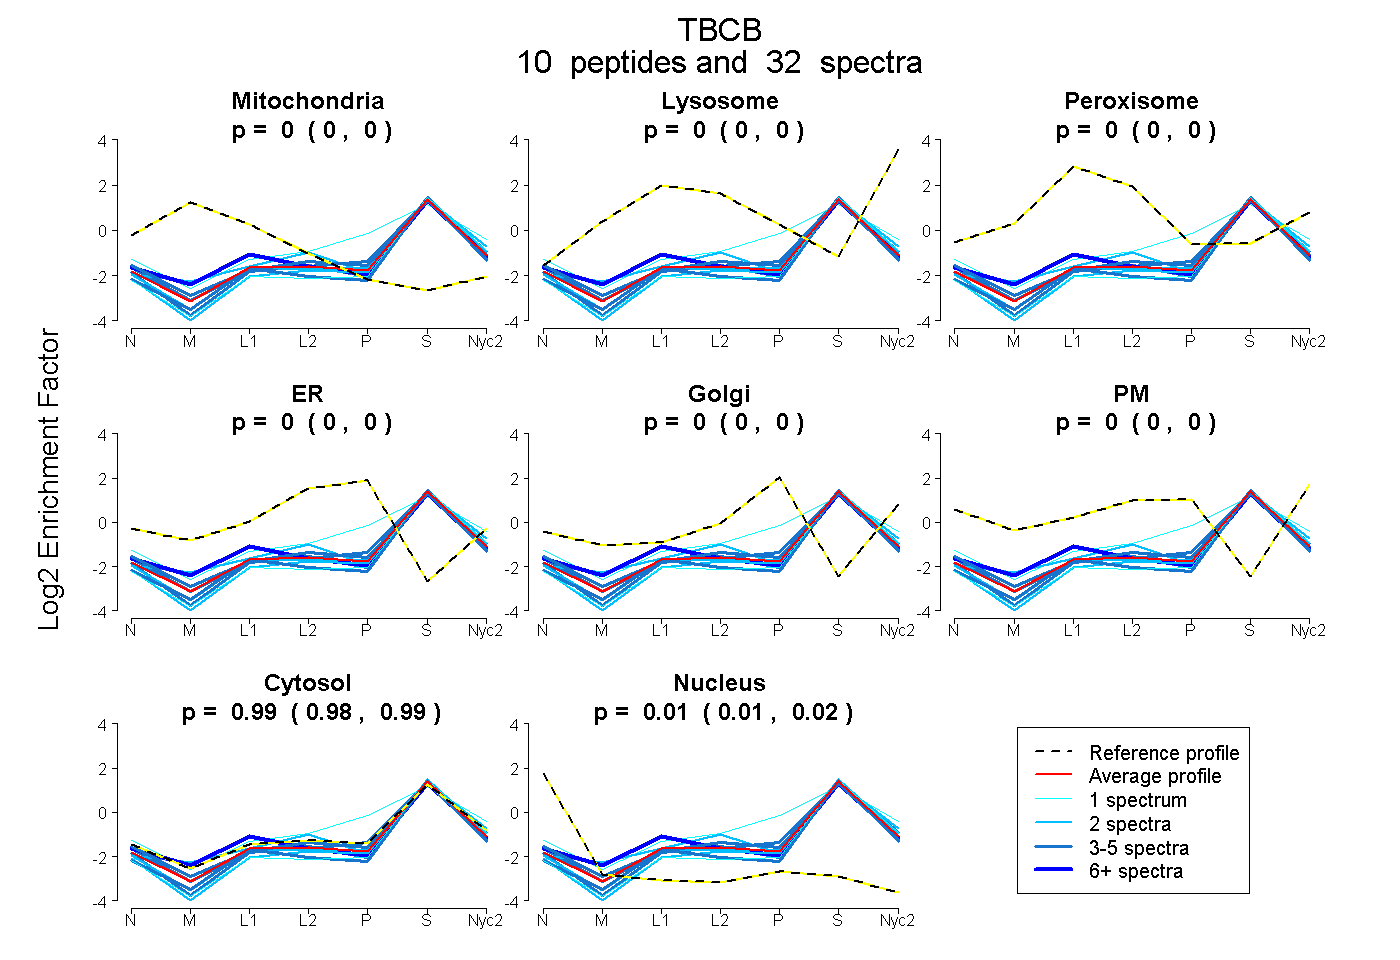
0.000 | 0.000
0.000 | 0.000
0.000 | 0.000
0.000 | 0.000
0.000 | 0.000
0.000 | 0.000
0.983 | 0.990
0.009 | 0.016
6peptides
spectra
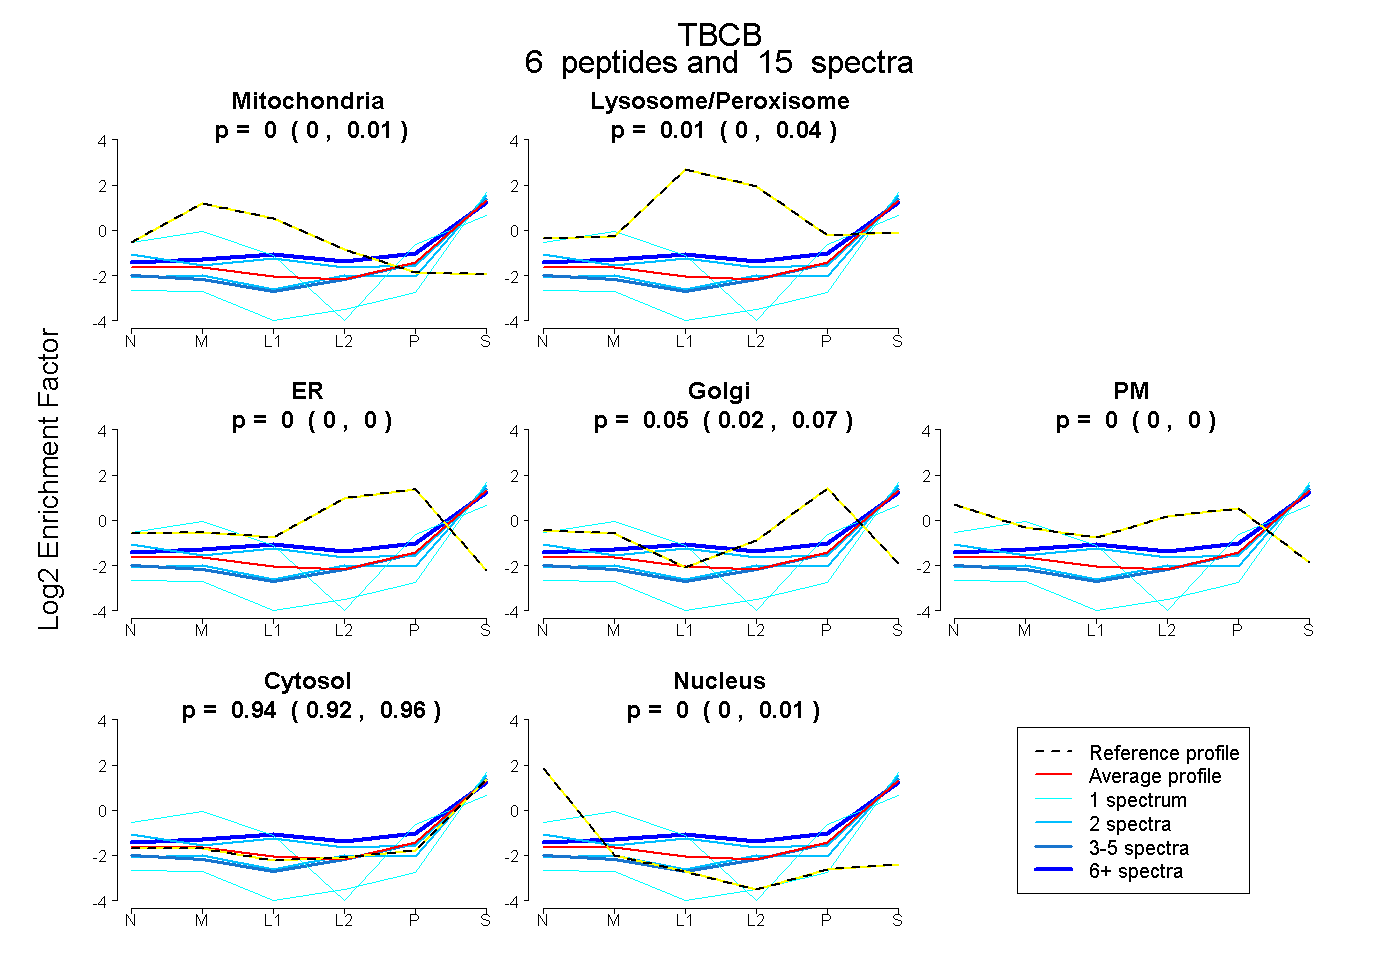
0.000 | 0.005
0.000 | 0.040
0.000 | 0.000
0.016 | 0.065
0.000 | 0.000
0.918 | 0.958
0.000 | 0.005