 10
10peptides
spectra
0.000 | 0.000
0.000 | 0.000
0.000 | 0.000
0.000 | 0.000
0.000 | 0.000
0.000 | 0.000
0.983 | 0.990
0.009 | 0.016
| Plot | Mito | Lyso | Perox | ER | Golgi | PM | Cytosol | Nucleus | |||||
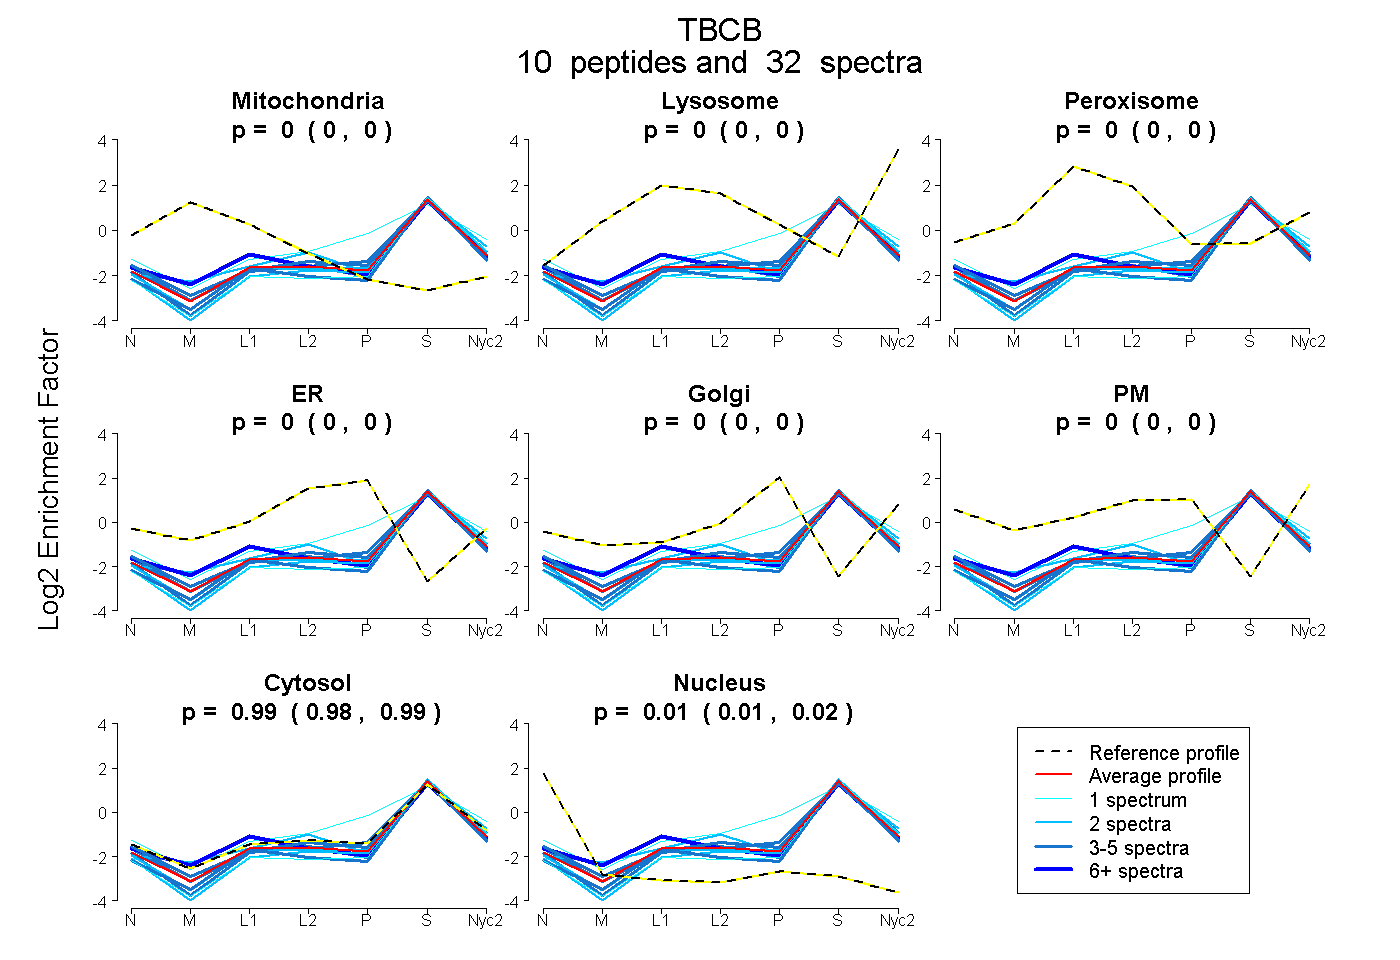
| Expt A |
10 peptides |
32 spectra |
|
0.000 0.000 | 0.000 |
0.000 0.000 | 0.000 |
0.000 0.000 | 0.000 |
0.000 0.000 | 0.000 |
0.000 0.000 | 0.000 |
0.000 0.000 | 0.000 |
0.987 0.983 | 0.990 |
0.013 0.009 | 0.016 |
| 5 spectra, YDEPLGK | 0.000 | 0.000 | 0.000 | 0.000 | 0.000 | 0.000 | 0.964 | 0.036 | ||
| 7 spectra, LGEYEDVSK | 0.041 | 0.000 | 0.000 | 0.000 | 0.000 | 0.000 | 0.959 | 0.000 | ||
| 1 spectrum, YFECQAK | 0.000 | 0.000 | 0.000 | 0.000 | 0.000 | 0.000 | 0.985 | 0.015 | ||
| 4 spectra, APGQSLR | 0.000 | 0.000 | 0.000 | 0.000 | 0.000 | 0.000 | 0.990 | 0.010 | ||
| 2 spectra, LSEEEAQASAISVGSR | 0.000 | 0.000 | 0.000 | 0.000 | 0.000 | 0.000 | 0.981 | 0.019 | ||
| 2 spectra, LGPYNEELR | 0.000 | 0.000 | 0.000 | 0.000 | 0.000 | 0.000 | 0.996 | 0.004 | ||
| 1 spectrum, GTVMYVGLTDFKPGYWVGVR | 0.000 | 0.000 | 0.000 | 0.000 | 0.177 | 0.000 | 0.823 | 0.000 | ||
| 4 spectra, YEISPEAYER | 0.000 | 0.000 | 0.000 | 0.000 | 0.000 | 0.000 | 0.970 | 0.030 | ||
| 4 spectra, AQQEAEAAQR | 0.000 | 0.000 | 0.000 | 0.000 | 0.000 | 0.000 | 0.980 | 0.020 | ||
| 2 spectra, IHVIDHSGVR | 0.000 | 0.008 | 0.000 | 0.000 | 0.000 | 0.000 | 0.992 | 0.000 |
| Plot | Mito | Lyso or Perox | ER | Golgi | PM | Cytosol | Nucleus | ||||||
| Expt B |
6 peptides |
15 spectra |
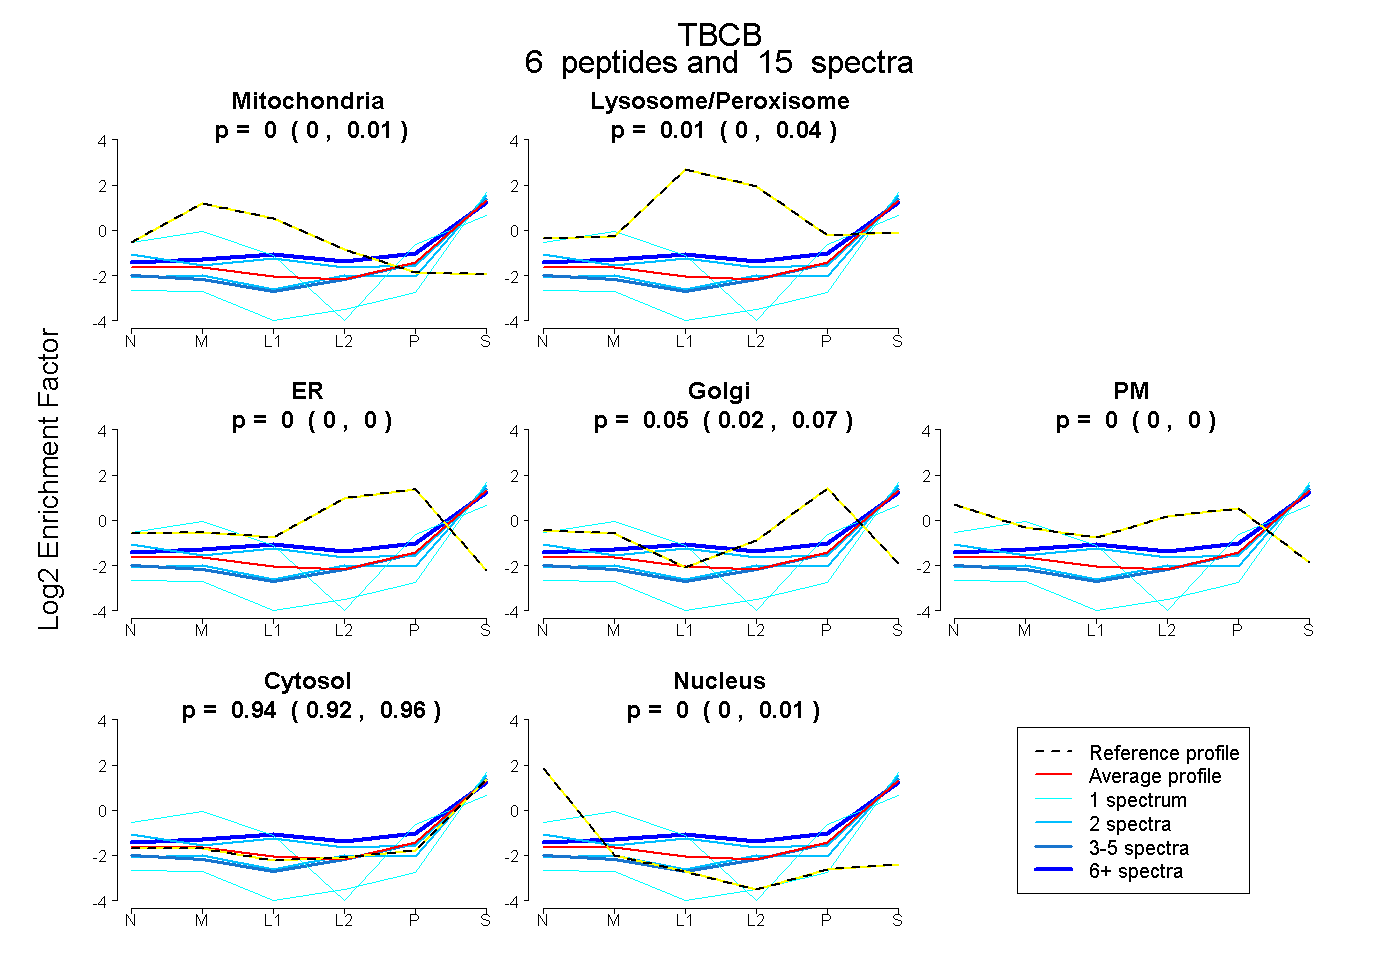 |
0.000 0.000 | 0.005 |
0.011 0.000 | 0.040 |
0.000 0.000 | 0.000 |
0.048 0.016 | 0.065 |
0.000 0.000 | 0.000 |
0.941 0.918 | 0.958 |
0.000 0.000 | 0.005 |
|||
| Plot | Lyso | Other | |||||||||||
| Expt C |
8 peptides |
24 spectra |
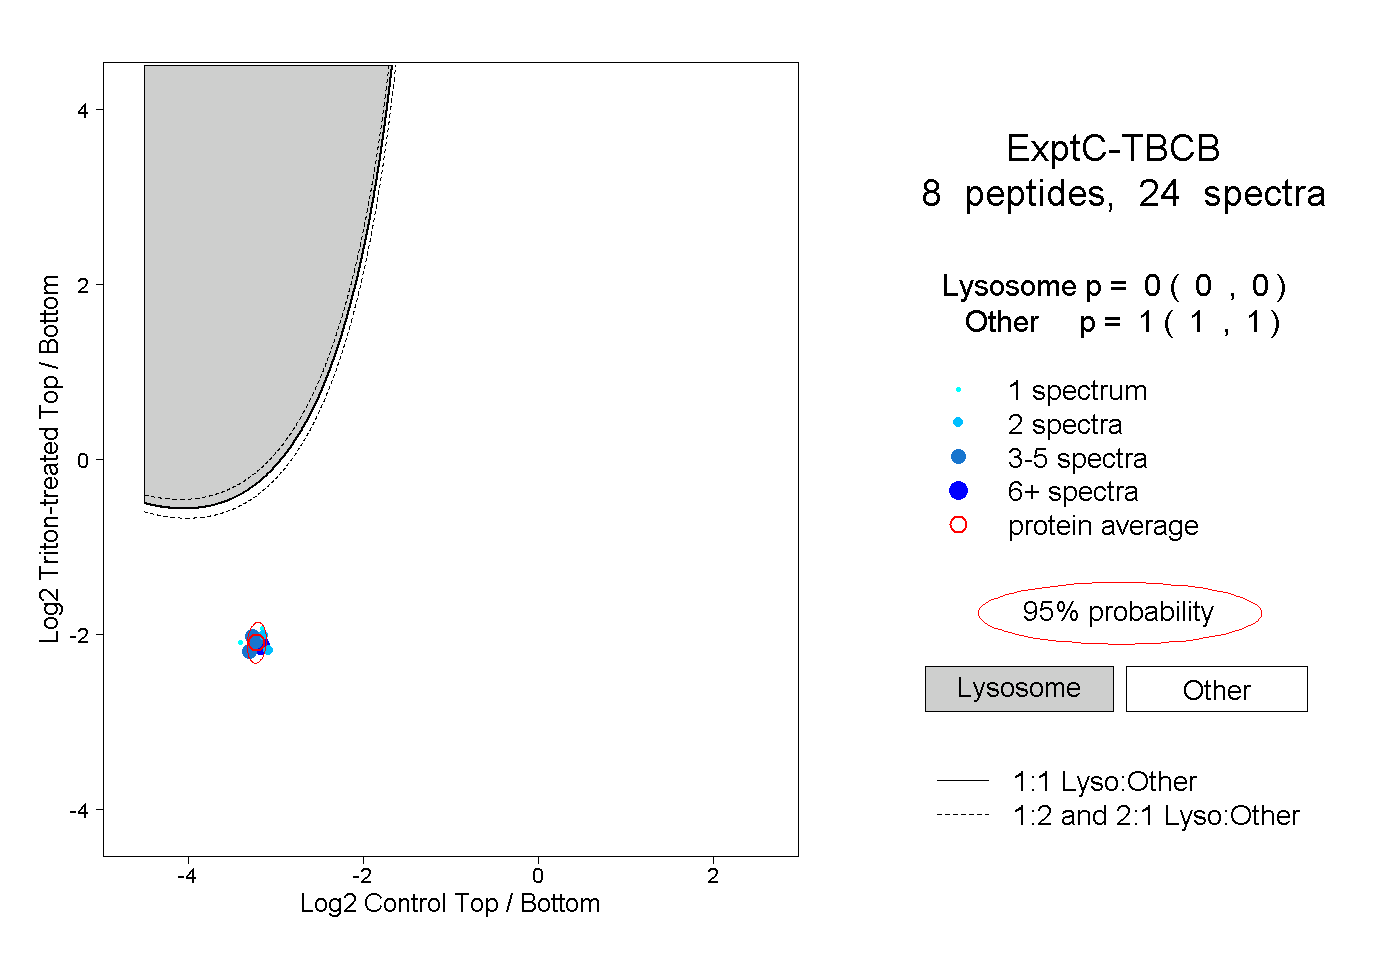 |
0.000 0.000 | 0.000 |
1.000 1.000 | 1.000 |
||||||||
| Plot | Lyso | Other | |||||||||||
| Expt D |
3 peptides |
4 spectra |
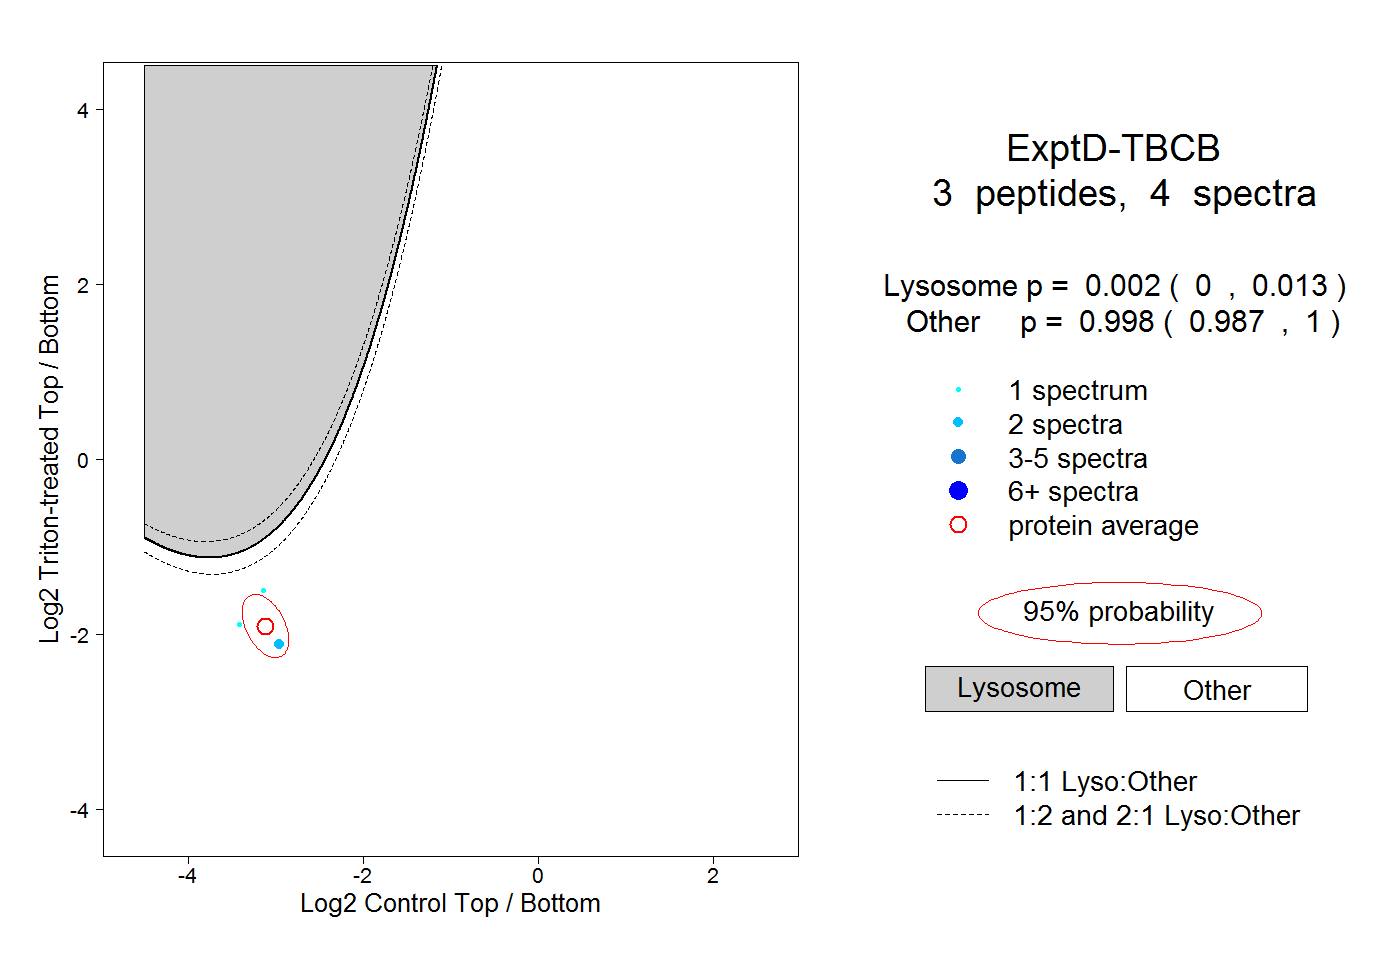 |
0.002 0.000 | 0.013 |
0.998 0.987 | 1.000 |