 3
3peptides
spectra
0.000 | 0.273
0.000 | 0.127
0.000 | 0.270
0.000 | 0.000
0.000 | 0.000
0.000 | 0.213
0.466 | 0.692
0.000 | 0.114
2peptides
spectra
0.000 | 0.000
1.000 | 1.000
| Plot | Mito | Lyso | Perox | ER | Golgi | PM | Cytosol | Nucleus | |||||
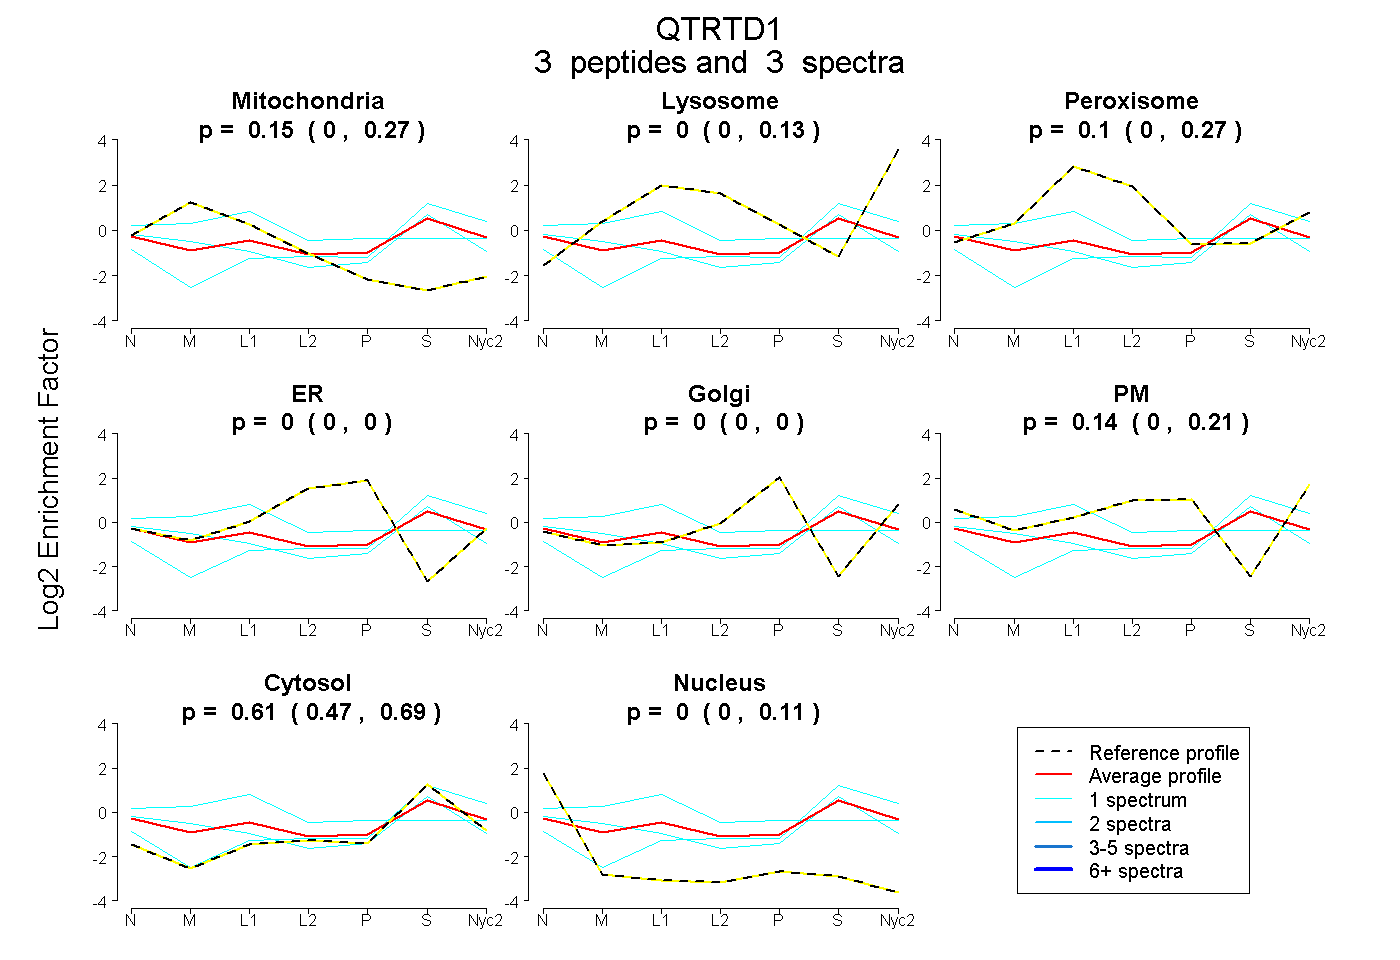
| Expt A |
3 peptides |
3 spectra |
|
0.153 0.000 | 0.273 |
0.000 0.000 | 0.127 |
0.103 0.000 | 0.270 |
0.000 0.000 | 0.000 |
0.000 0.000 | 0.000 |
0.135 0.000 | 0.213 |
0.609 0.466 | 0.692 |
0.000 0.000 | 0.114 |
||
| Plot | Lyso | Other | |||||||||||
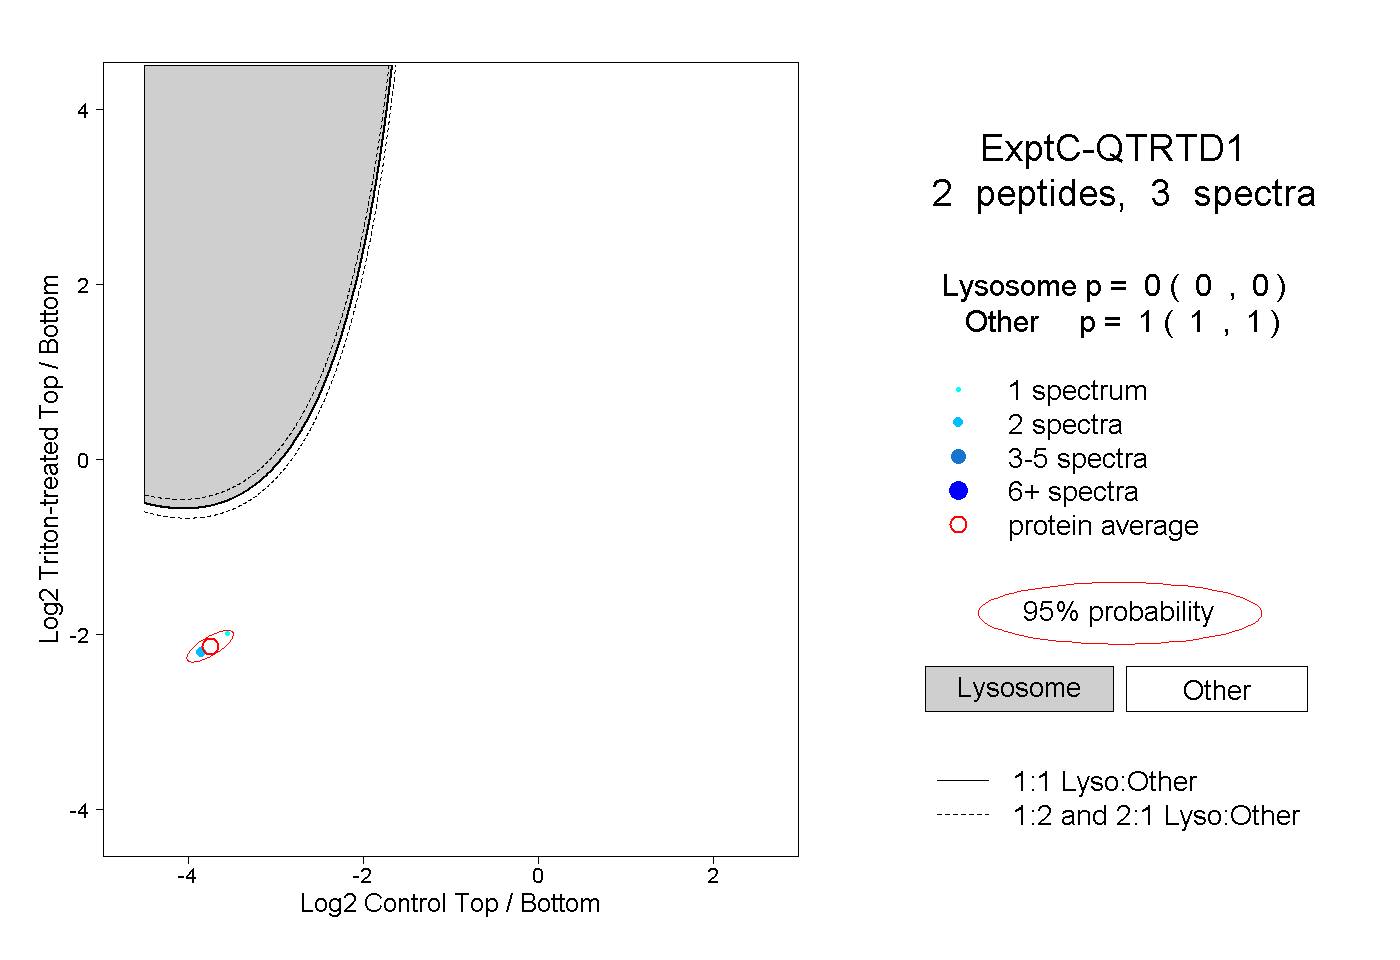
| Expt C |
2 peptides |
3 spectra |
|
0.000 0.000 | 0.000 |
1.000 1.000 | 1.000 |