 17
17peptides
spectra
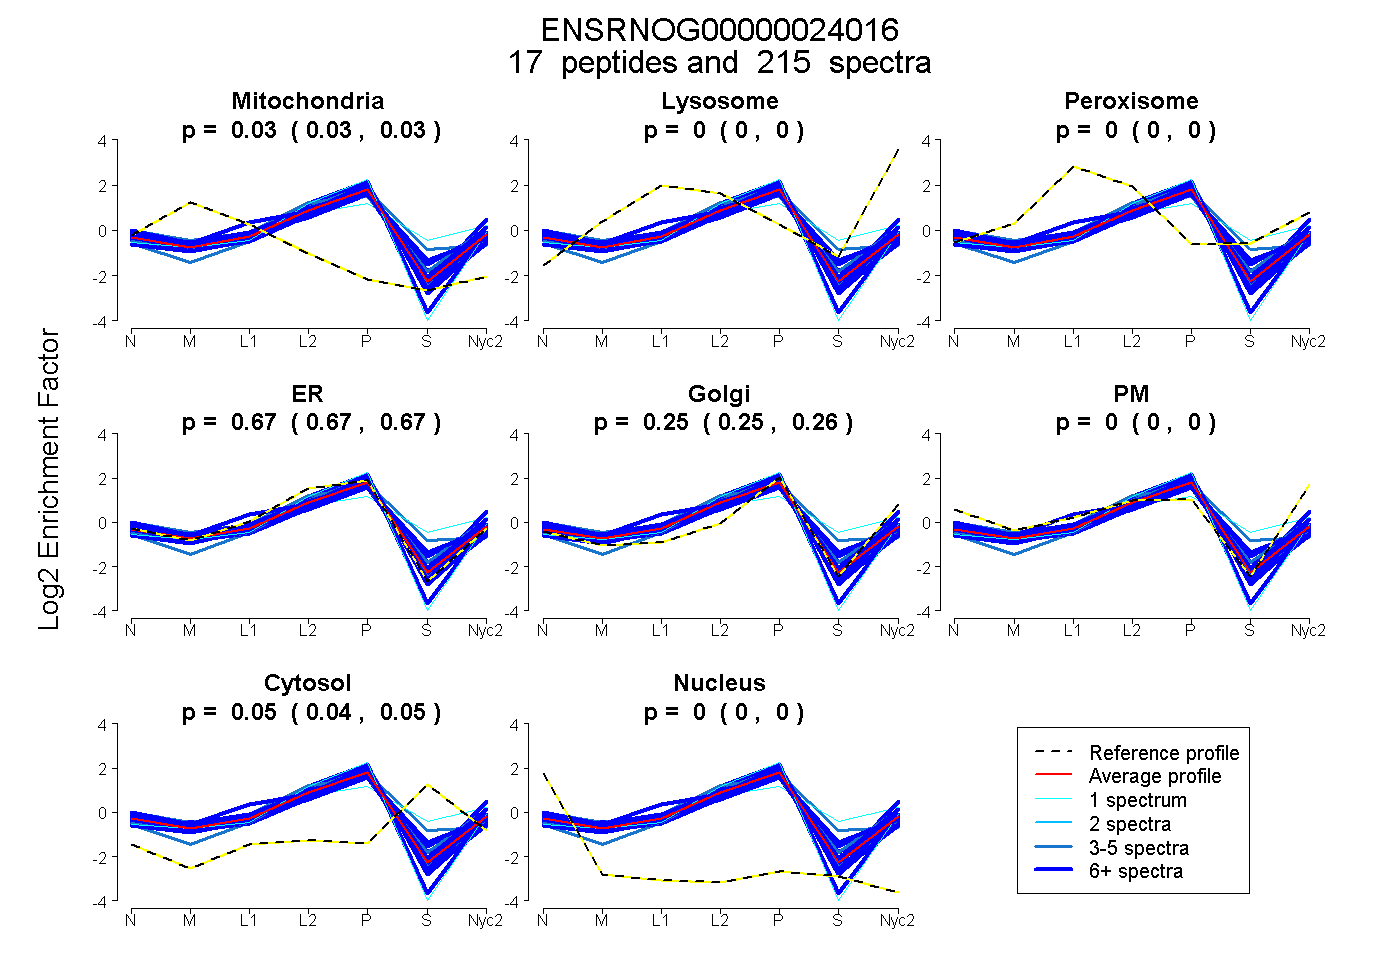
0.026 | 0.030
0.000 | 0.000
0.000 | 0.000
0.668 | 0.675
0.247 | 0.256
0.000 | 0.000
0.045 | 0.051
0.000 | 0.000
18peptides
spectra
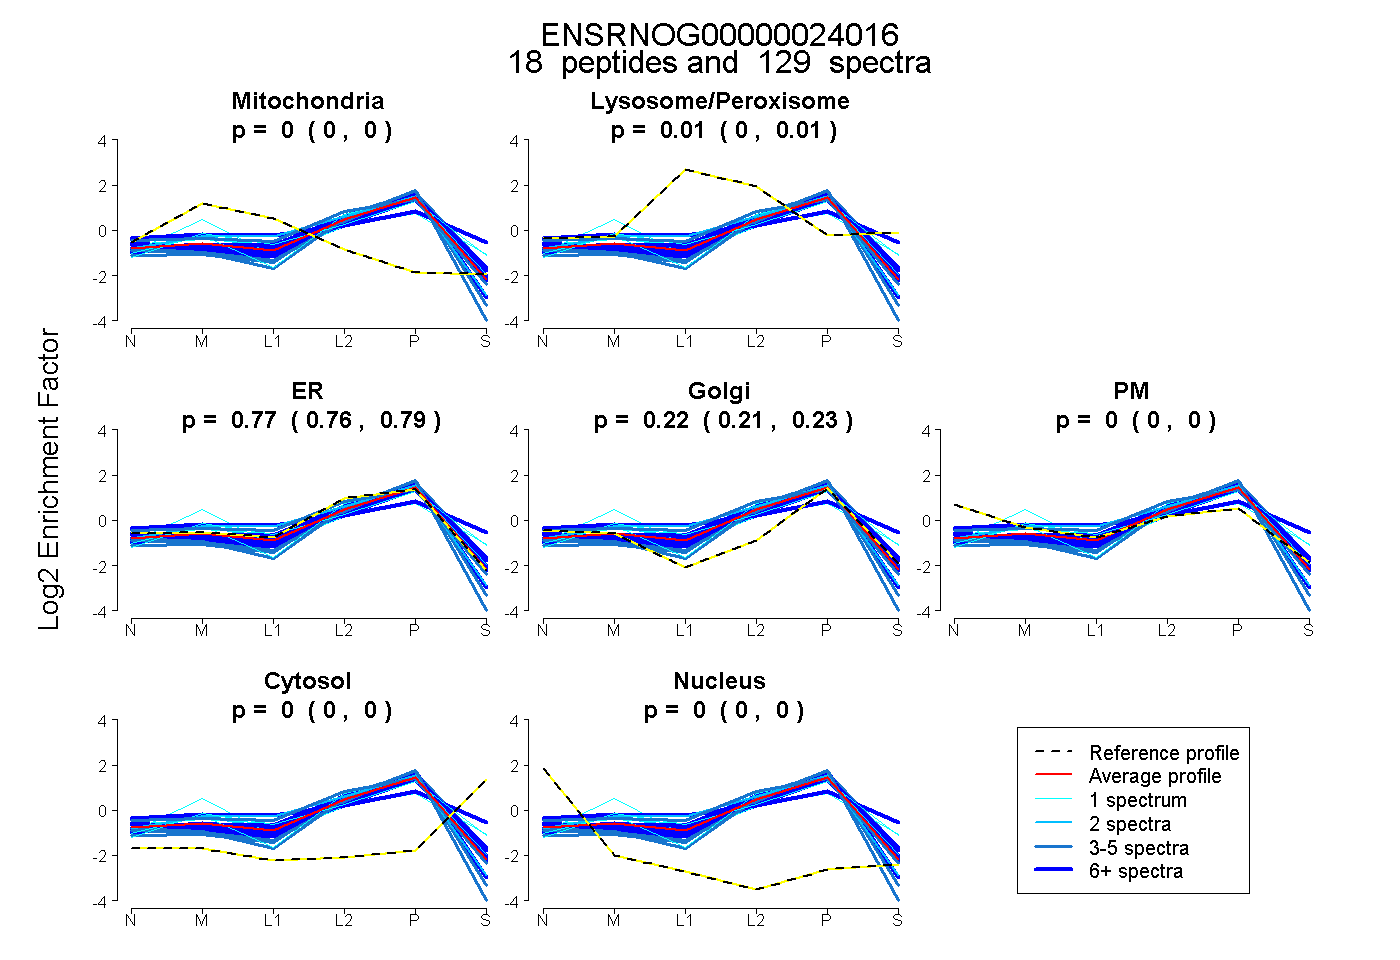
0.000 | 0.003
0.000 | 0.011
0.759 | 0.786
0.211 | 0.228
0.000 | 0.000
0.000 | 0.000
0.000 | 0.000
15peptides
spectra
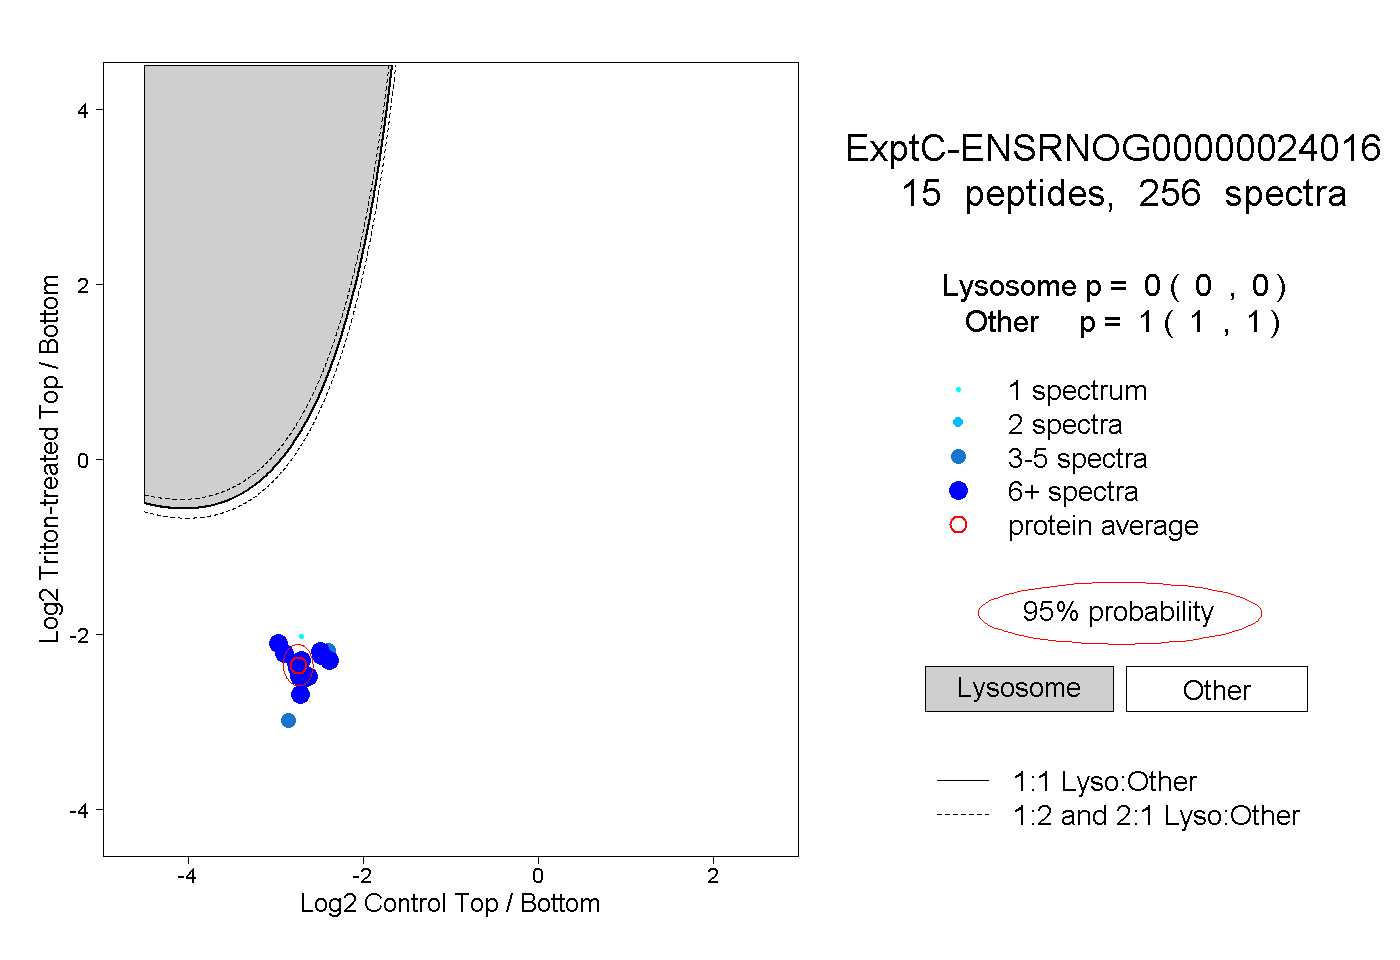
0.000 | 0.000
1.000 | 1.000
9peptides
spectra
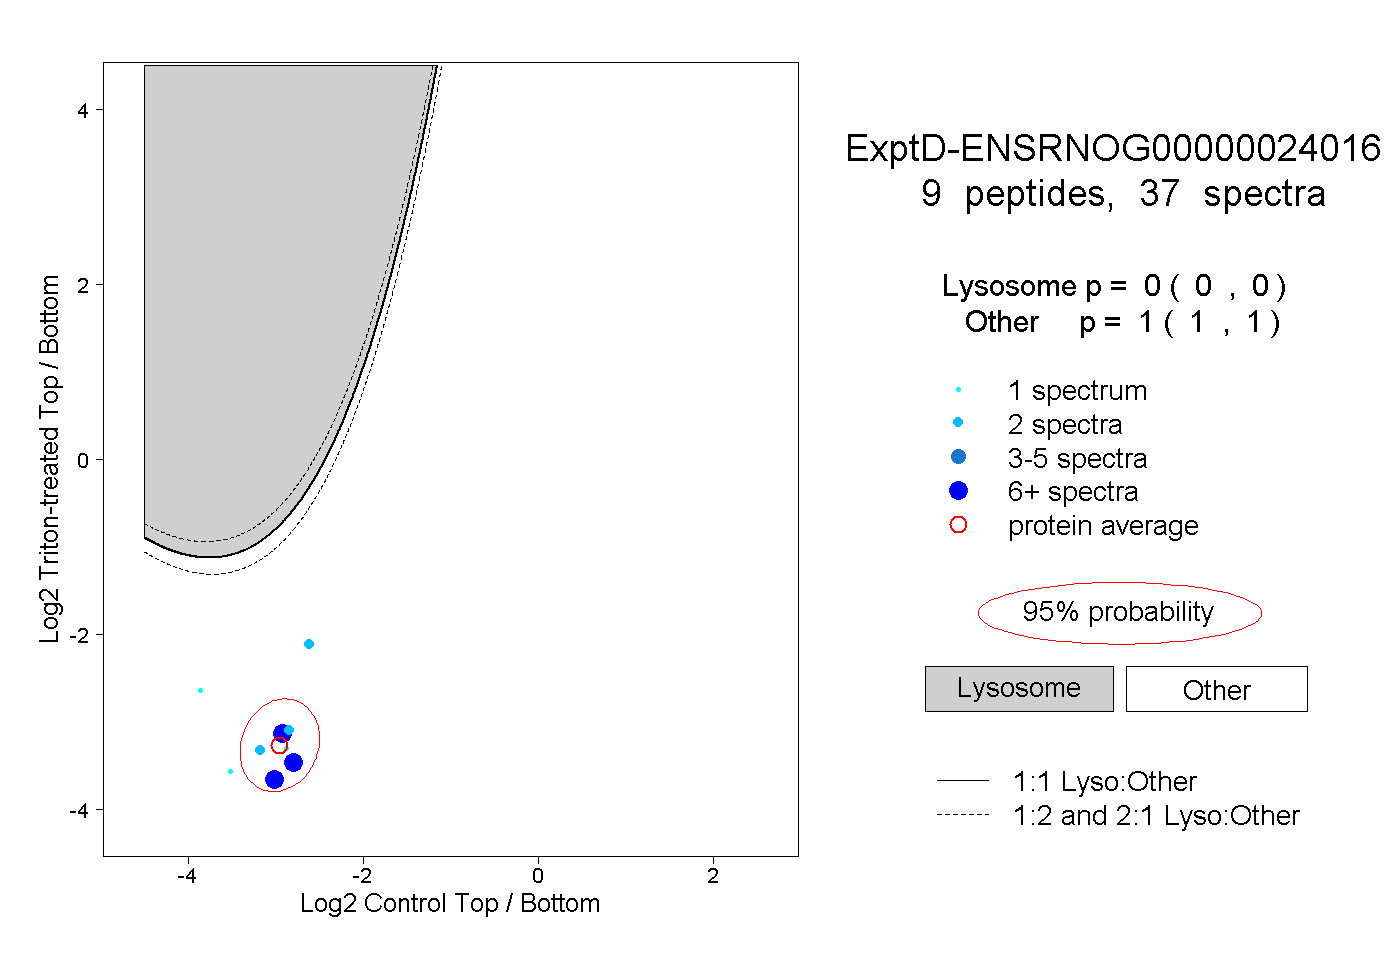
0.000 | 0.000
1.000 | 1.000