 7
7peptides
spectra
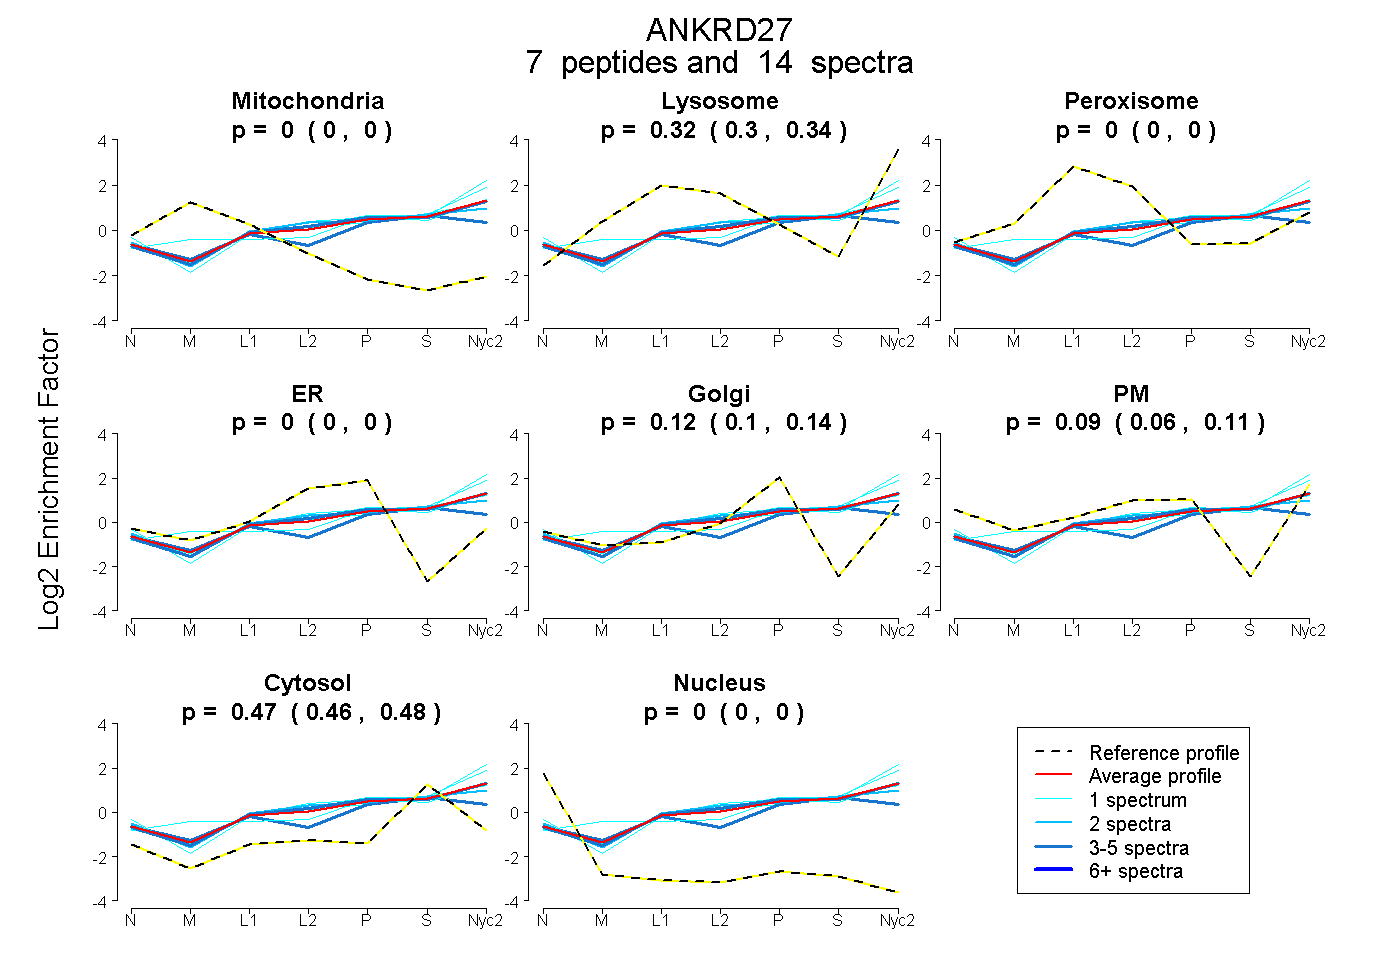
0.000 | 0.000
0.299 | 0.336
0.000 | 0.000
0.000 | 0.000
0.099 | 0.137
0.061 | 0.110
0.462 | 0.482
0.000 | 0.000
1peptide
spectra
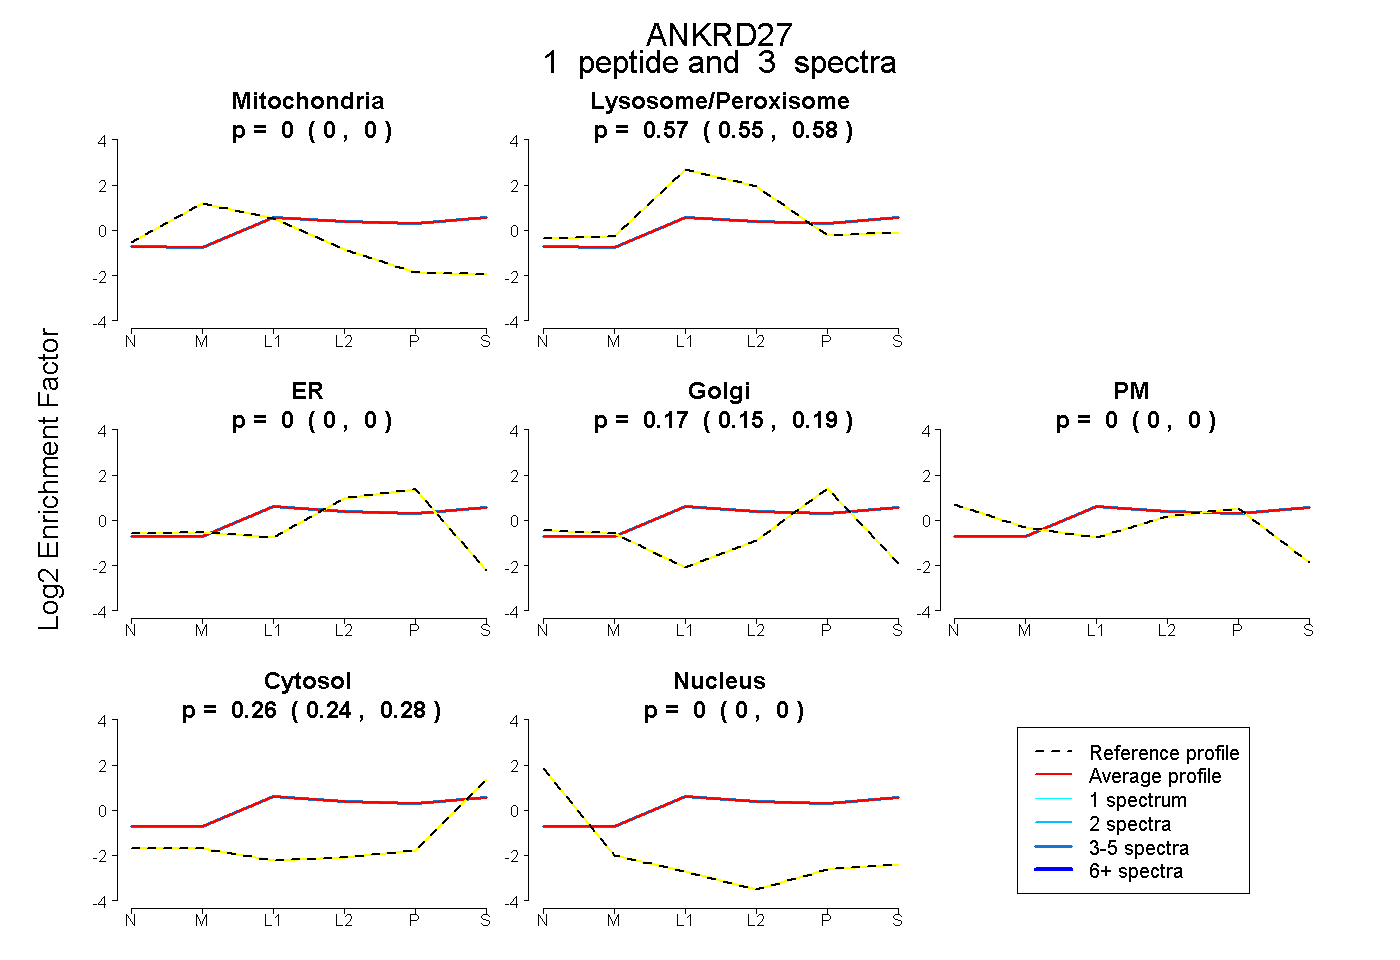
0.000 | 0.000
0.552 | 0.577
0.000 | 0.000
0.150 | 0.190
0.000 | 0.000
0.241 | 0.281
0.000 | 0.000
18peptides
spectra
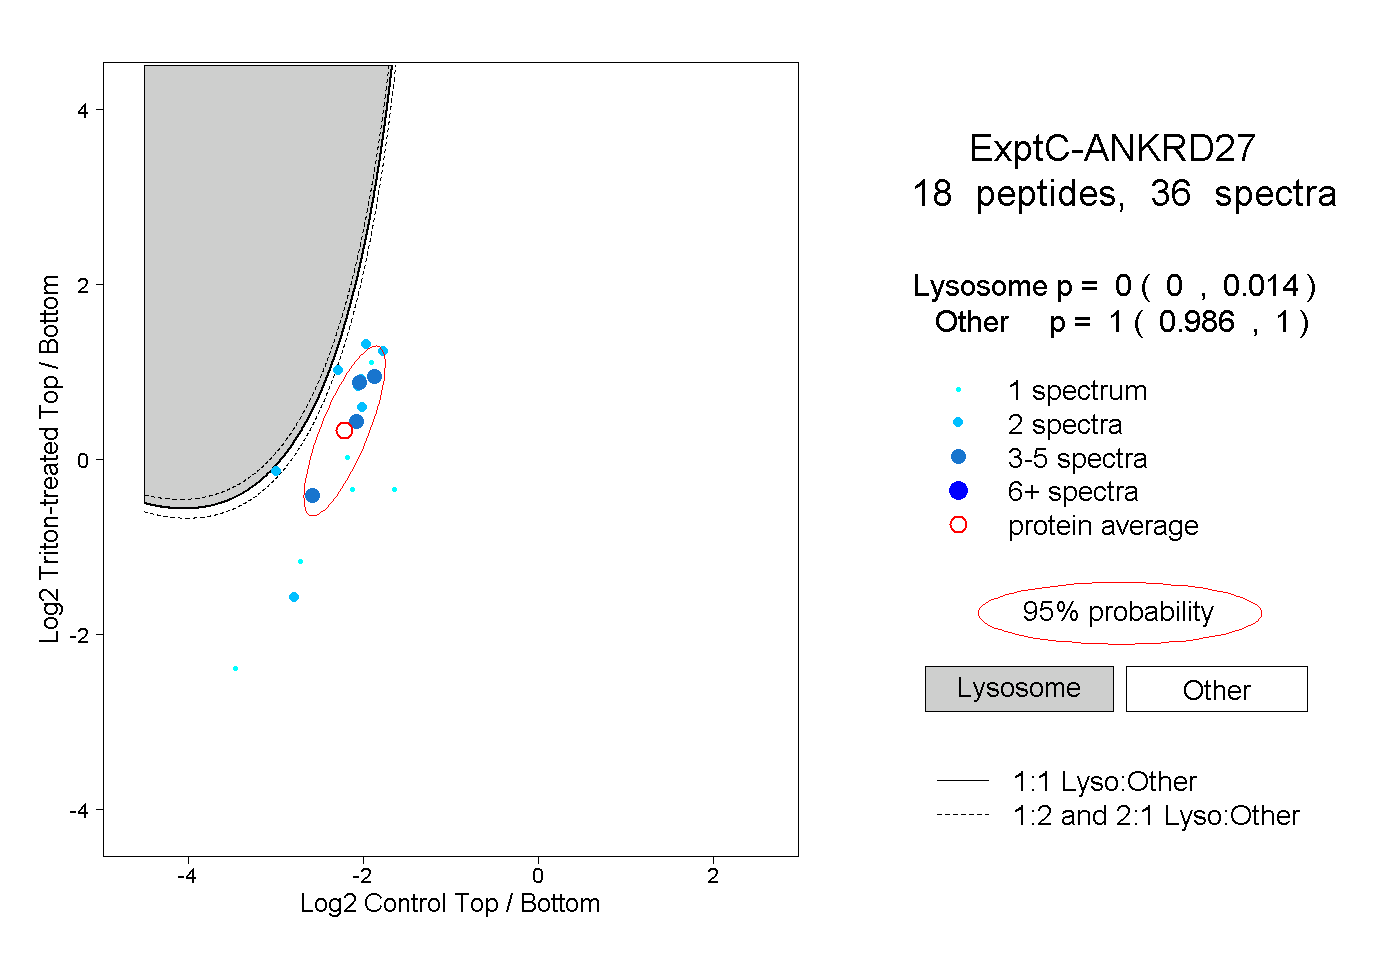
0.000 | 0.014
0.986 | 1.000