 2
2peptides
spectra
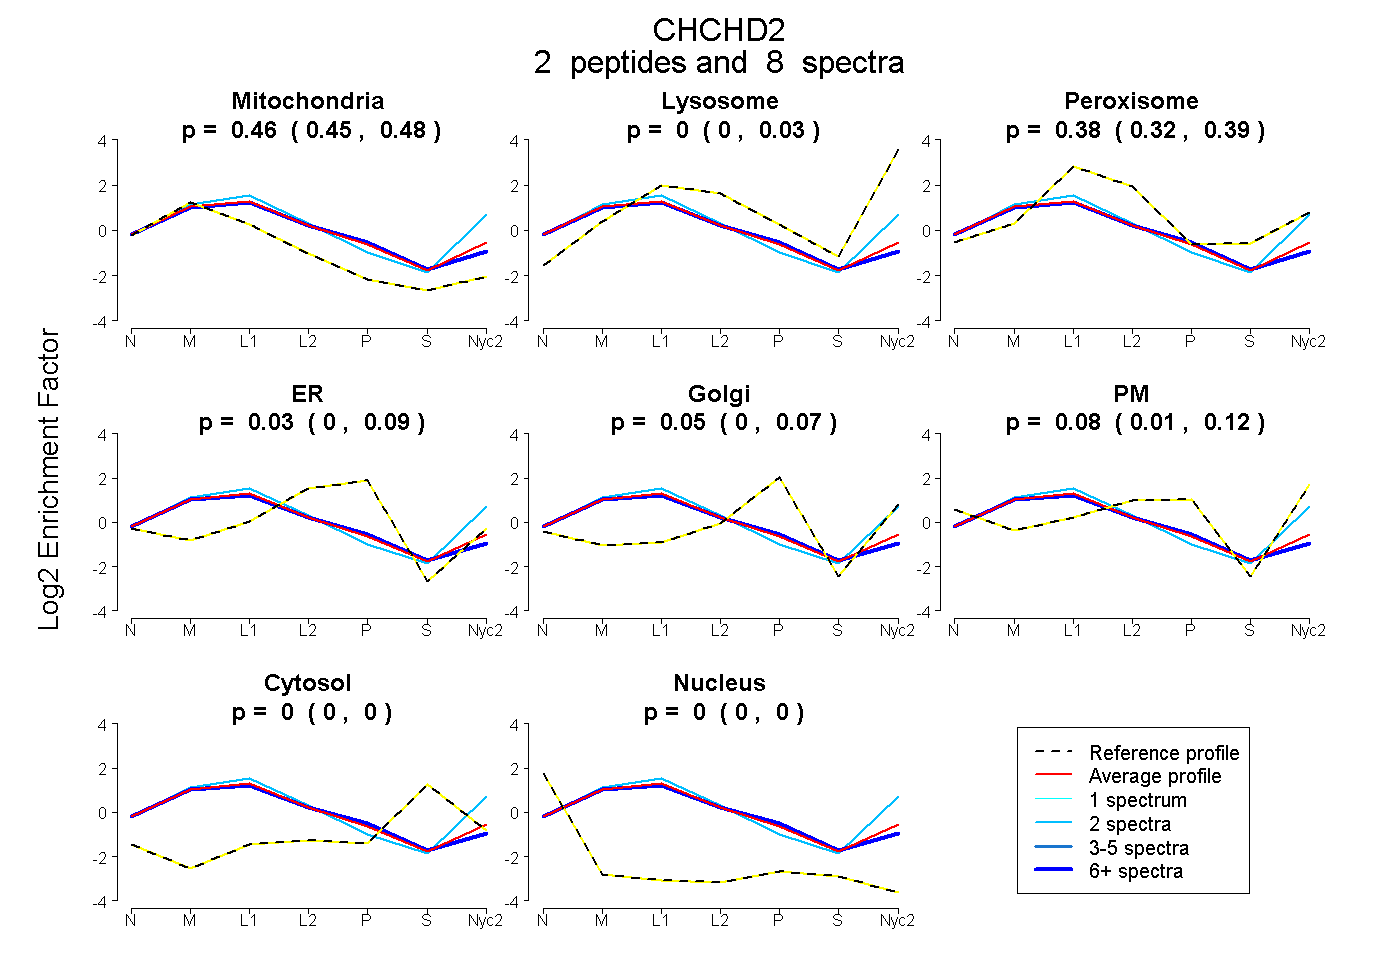
0.448 | 0.483
0.000 | 0.035
0.324 | 0.395
0.000 | 0.095
0.000 | 0.072
0.012 | 0.119
0.000 | 0.000
0.000 | 0.000
2peptides
spectra
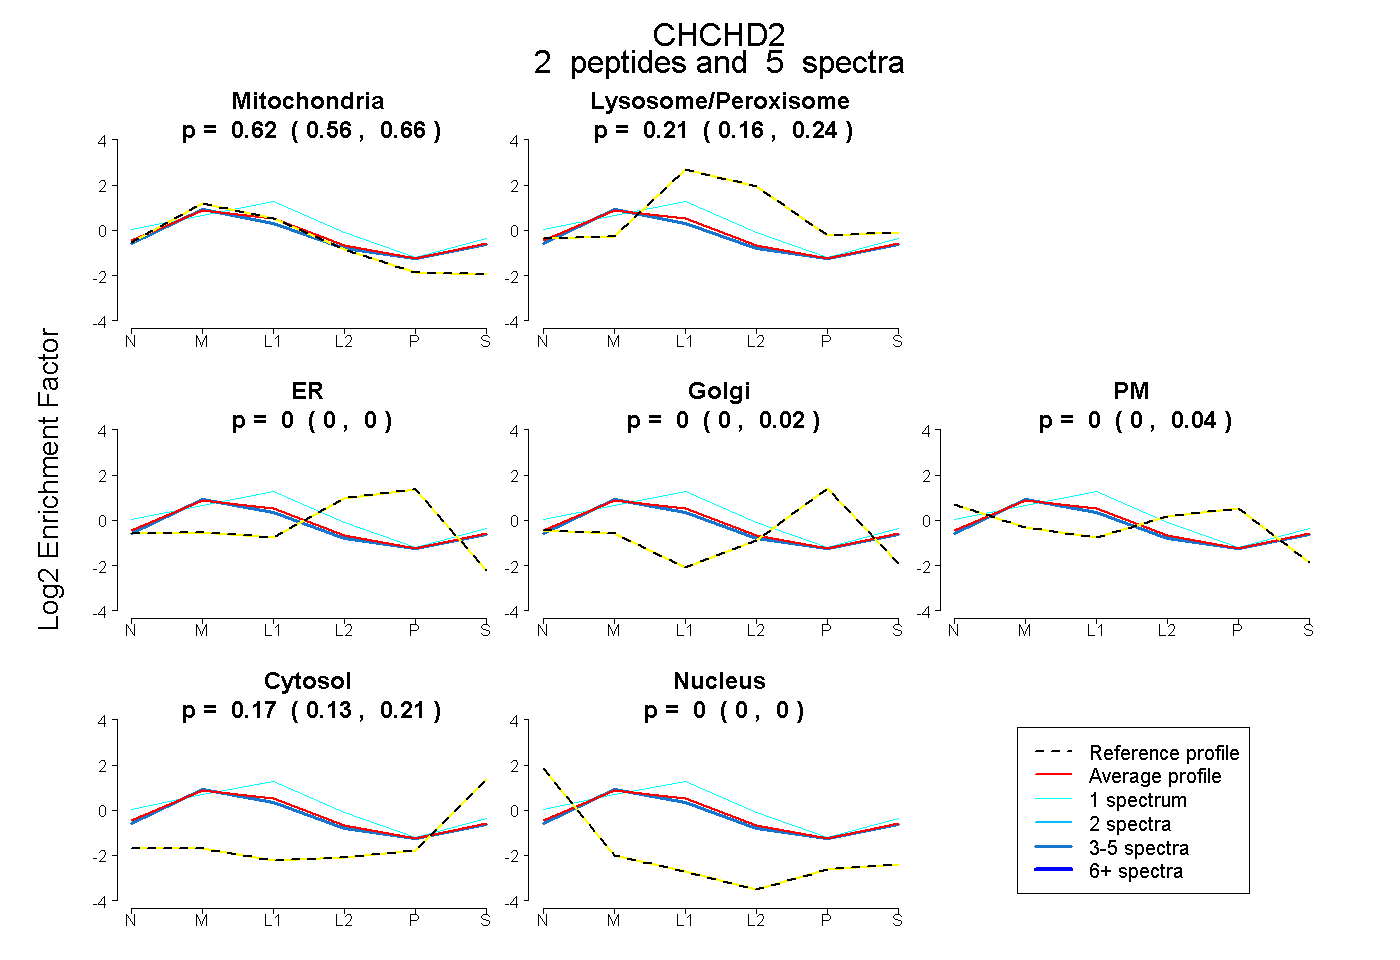
0.557 | 0.658
0.165 | 0.240
0.000 | 0.000
0.000 | 0.023
0.000 | 0.036
0.127 | 0.207
0.000 | 0.000
3peptides
spectra
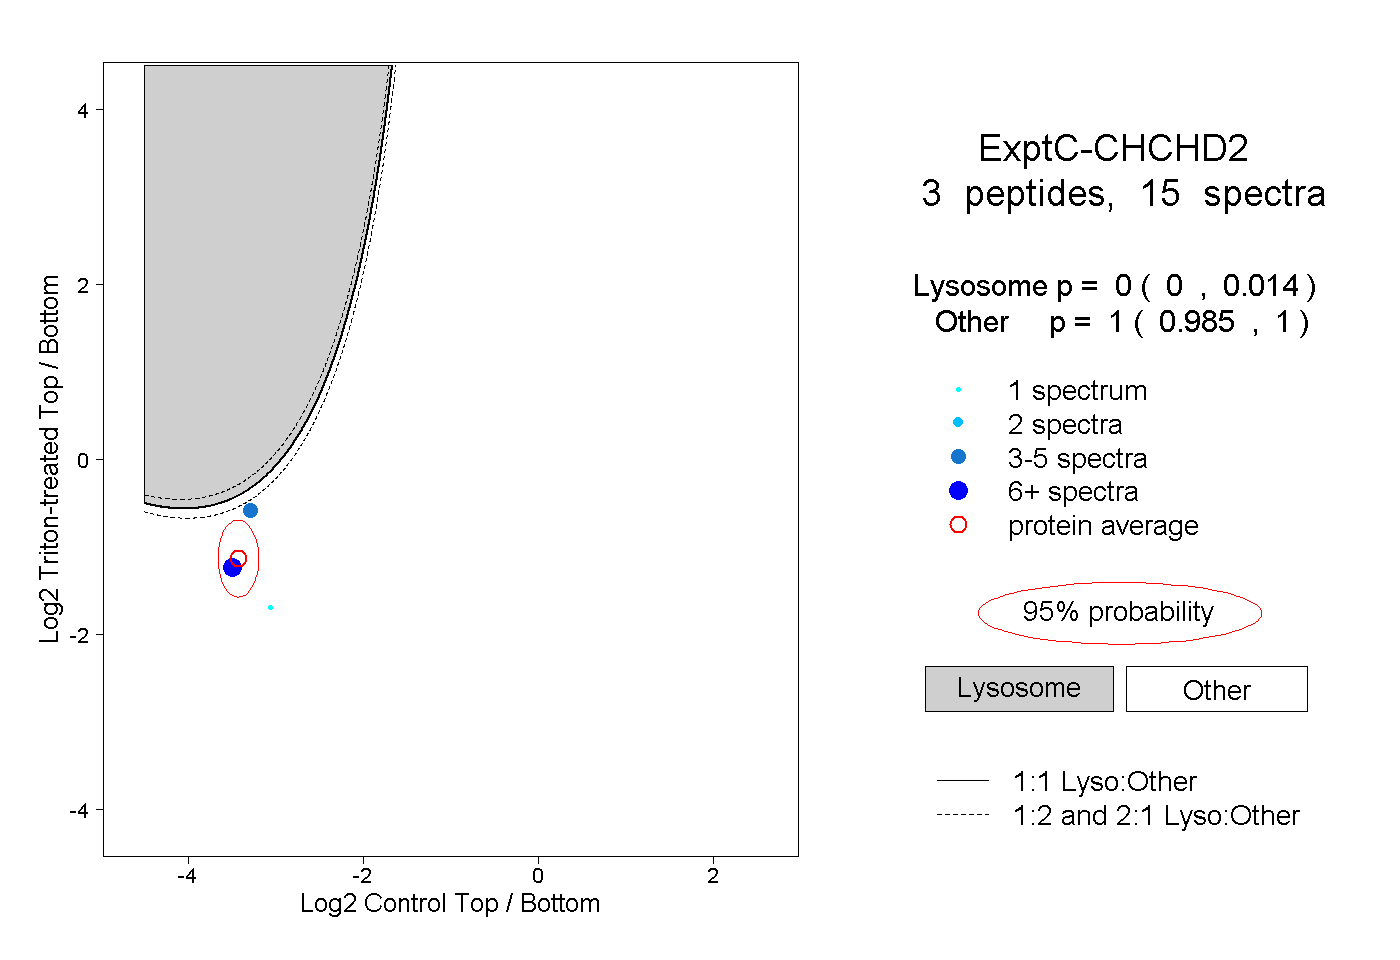
0.000 | 0.014
0.985 | 1.000
3peptides
spectra
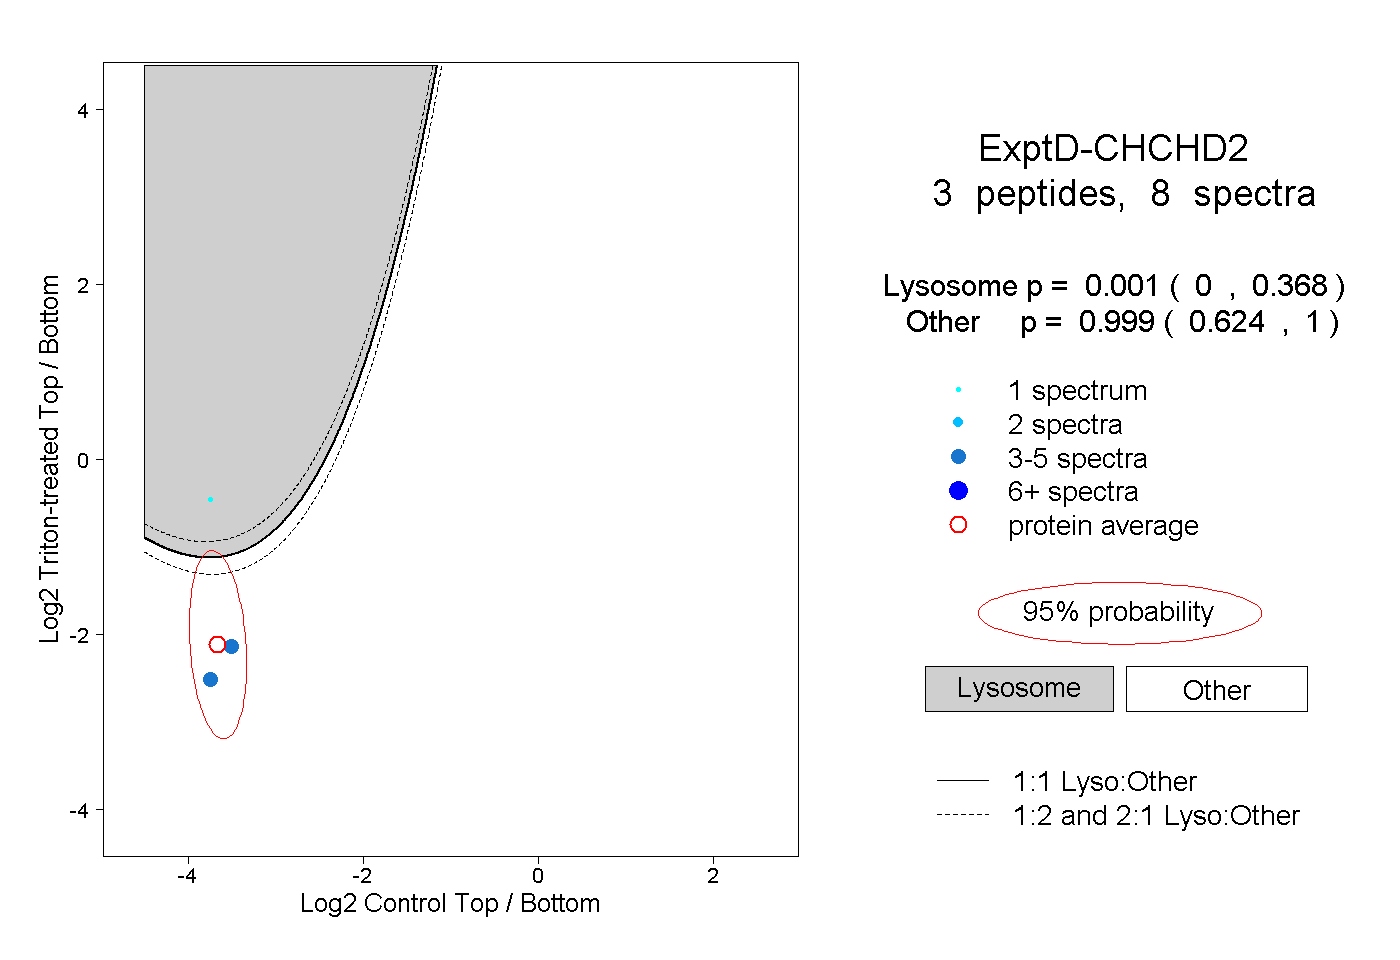
0.000 | 0.368
0.624 | 1.000