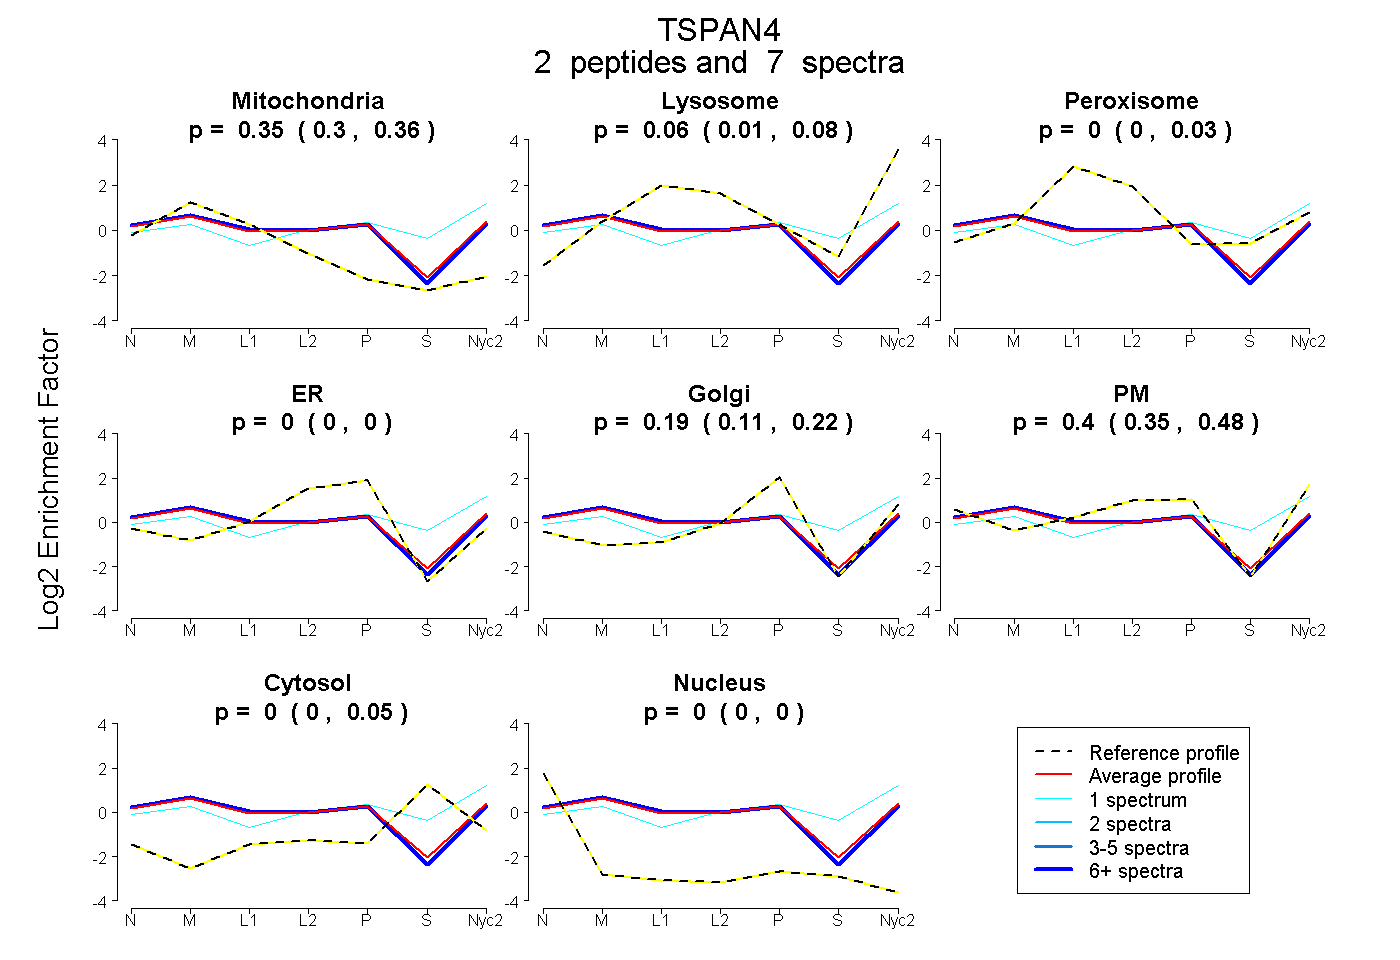
 2
2peptides
spectra
0.301 | 0.363
0.011 | 0.083
0.000 | 0.033
0.000 | 0.000
0.109 | 0.220
0.353 | 0.482
0.000 | 0.050
0.000 | 0.000
| Plot | Mito | Lyso | Perox | ER | Golgi | PM | Cytosol | Nucleus | |||||
| Expt A |
2 peptides |
7 spectra |
|
0.348 0.301 | 0.363 |
0.061 0.011 | 0.083 |
0.000 0.000 | 0.033 |
0.000 0.000 | 0.000 |
0.187 0.109 | 0.220 |
0.404 0.353 | 0.482 |
0.000 0.000 | 0.050 |
0.000 0.000 | 0.000 |
| 1 spectrum, ADTYCA | 0.058 | 0.161 | 0.000 | 0.000 | 0.026 | 0.453 | 0.302 | 0.000 | ||
| 6 spectra, SPCYETVK | 0.368 | 0.019 | 0.000 | 0.000 | 0.139 | 0.474 | 0.000 | 0.000 |
| Plot | Lyso | Other | |||||||||||
| Expt C |
2 peptides |
5 spectra |
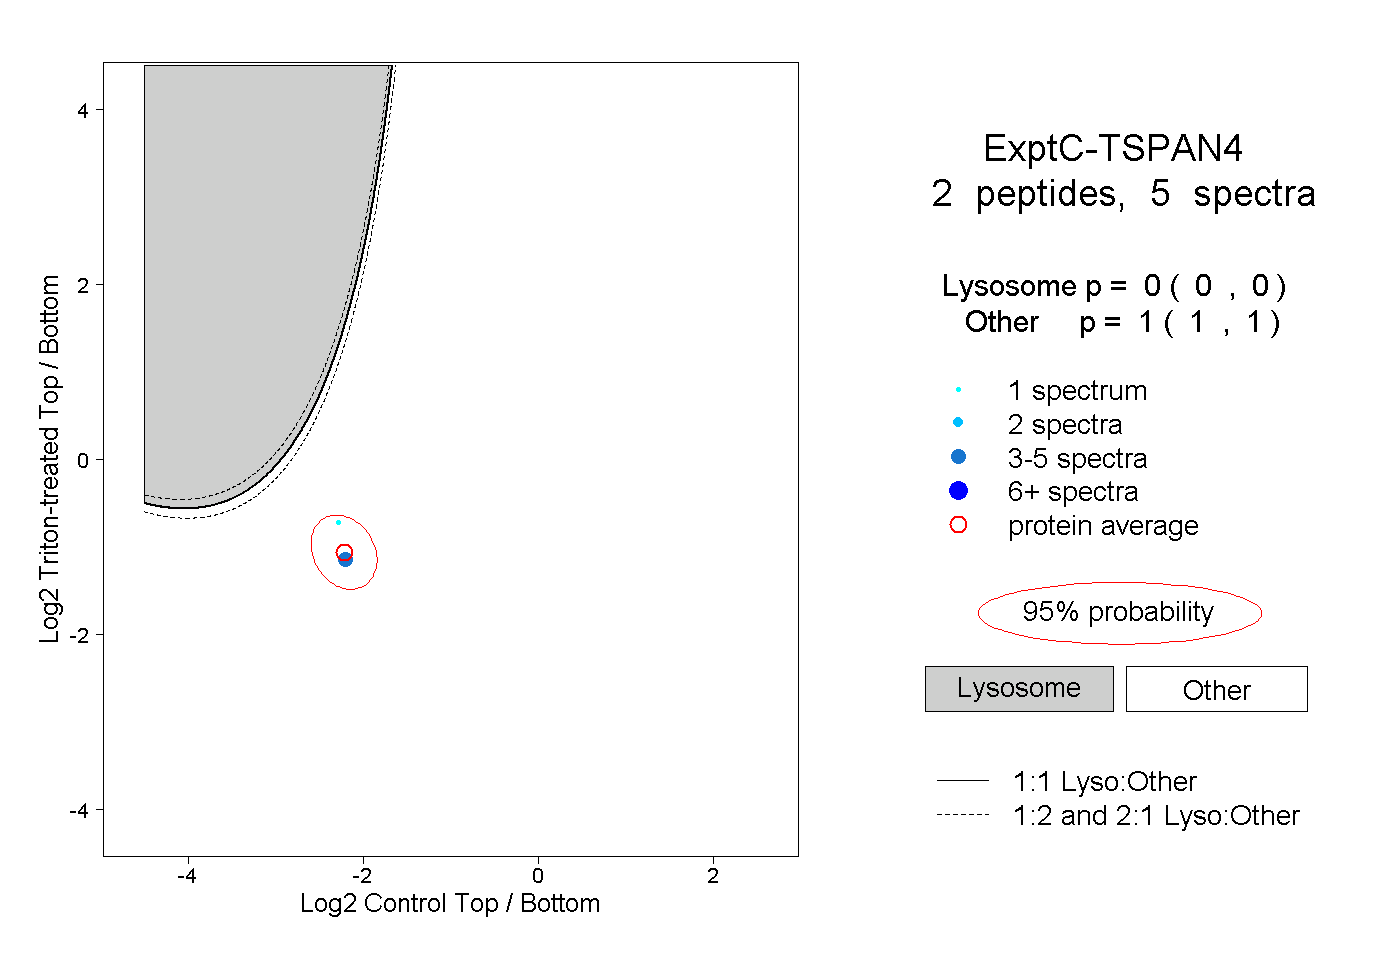 |
0.000 0.000 | 0.000 |
1.000 1.000 | 1.000 |