 8
8peptides
spectra
0.000 | 0.000
0.000 | 0.000
0.000 | 0.000
0.060 | 0.098
0.000 | 0.000
0.000 | 0.000
0.698 | 0.729
0.181 | 0.224
2peptides
spectra
NA | NA
NA | NA
NA | NA
NA | NA
NA | NA
NA | NA
NA | NA
| Plot | Mito | Lyso | Perox | ER | Golgi | PM | Cytosol | Nucleus | |||||
| Expt A |
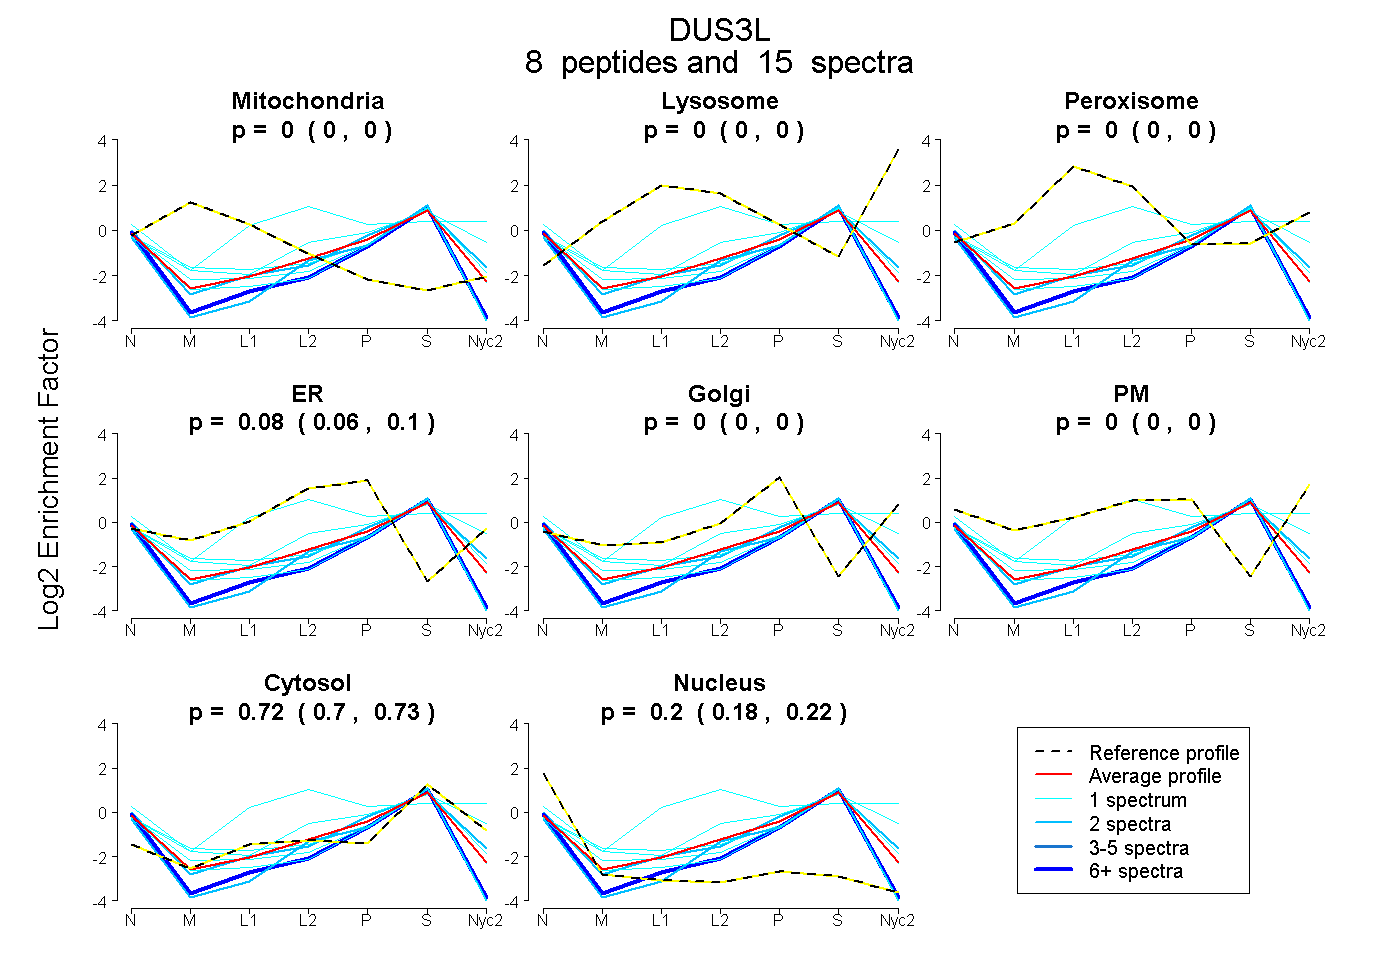
8 peptides |
15 spectra |
|
0.000 0.000 | 0.000 |
0.000 0.000 | 0.000 |
0.000 0.000 | 0.000 |
0.080 0.060 | 0.098 |
0.000 0.000 | 0.000 |
0.000 0.000 | 0.000 |
0.715 0.698 | 0.729 |
0.205 0.181 | 0.224 |
||
| Plot | Mito | Lyso or Perox | ER | Golgi | PM | Cytosol | Nucleus | ||||||
| Expt B |
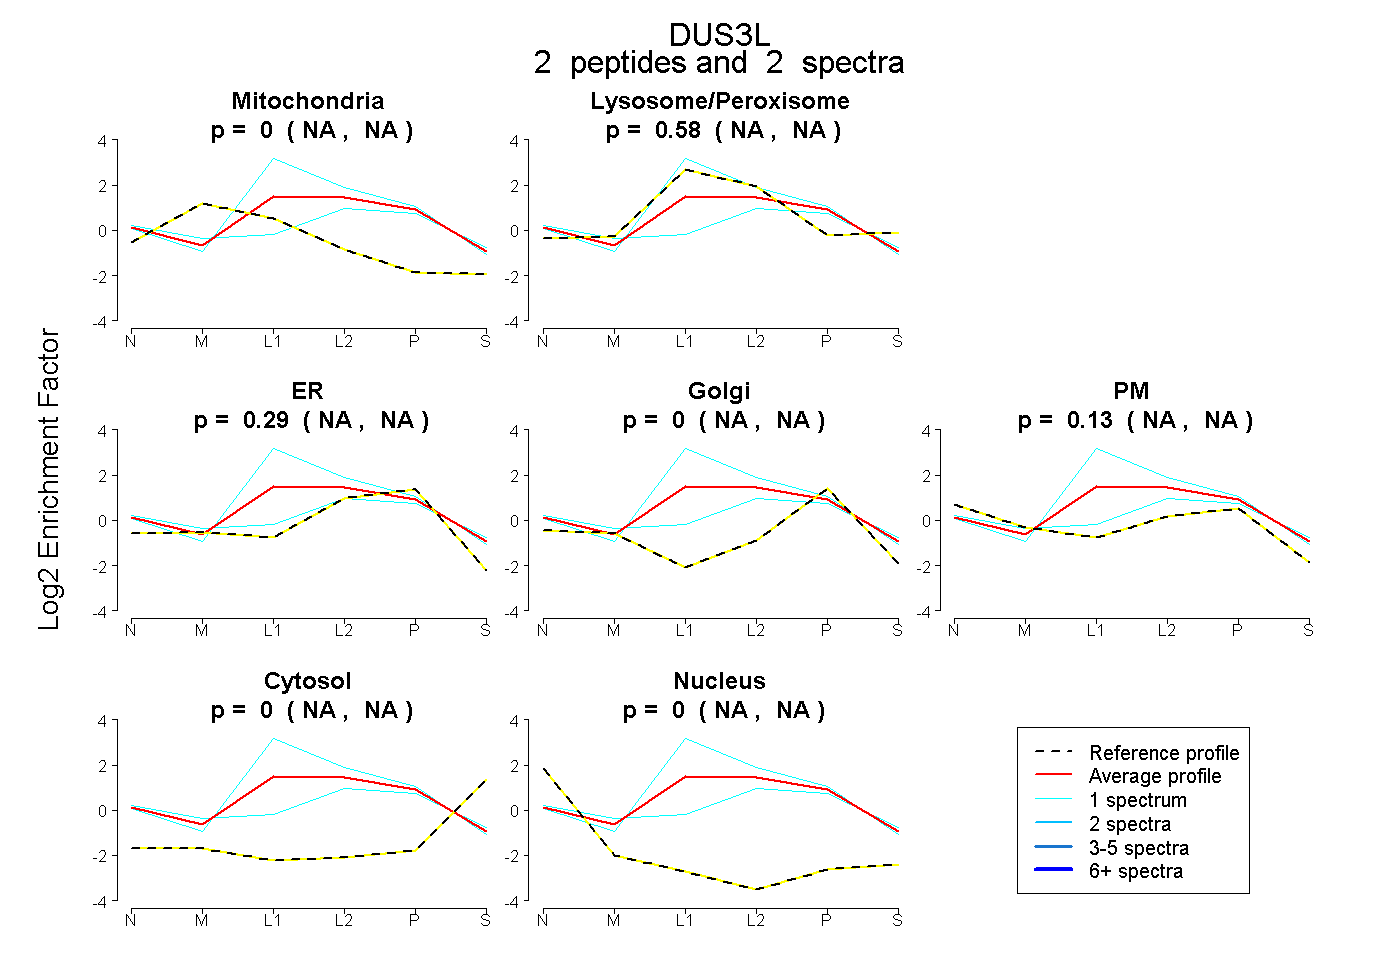
2 peptides |
2 spectra |
|
0.000 NA | NA |
0.583 NA | NA |
0.291 NA | NA |
0.000 NA | NA |
0.125 NA | NA |
0.000 NA | NA |
0.000 NA | NA |
| 1 spectrum, ALQQLQR | 0.000 | 0.302 | 0.185 | 0.084 | 0.389 | 0.041 | 0.000 | |||
| 1 spectrum, NWGVALVTLHGR | 0.000 | 0.871 | 0.129 | 0.000 | 0.000 | 0.000 | 0.000 |
| Plot | Lyso | Other | |||||||||||
| Expt C |
2 peptides |
2 spectra |
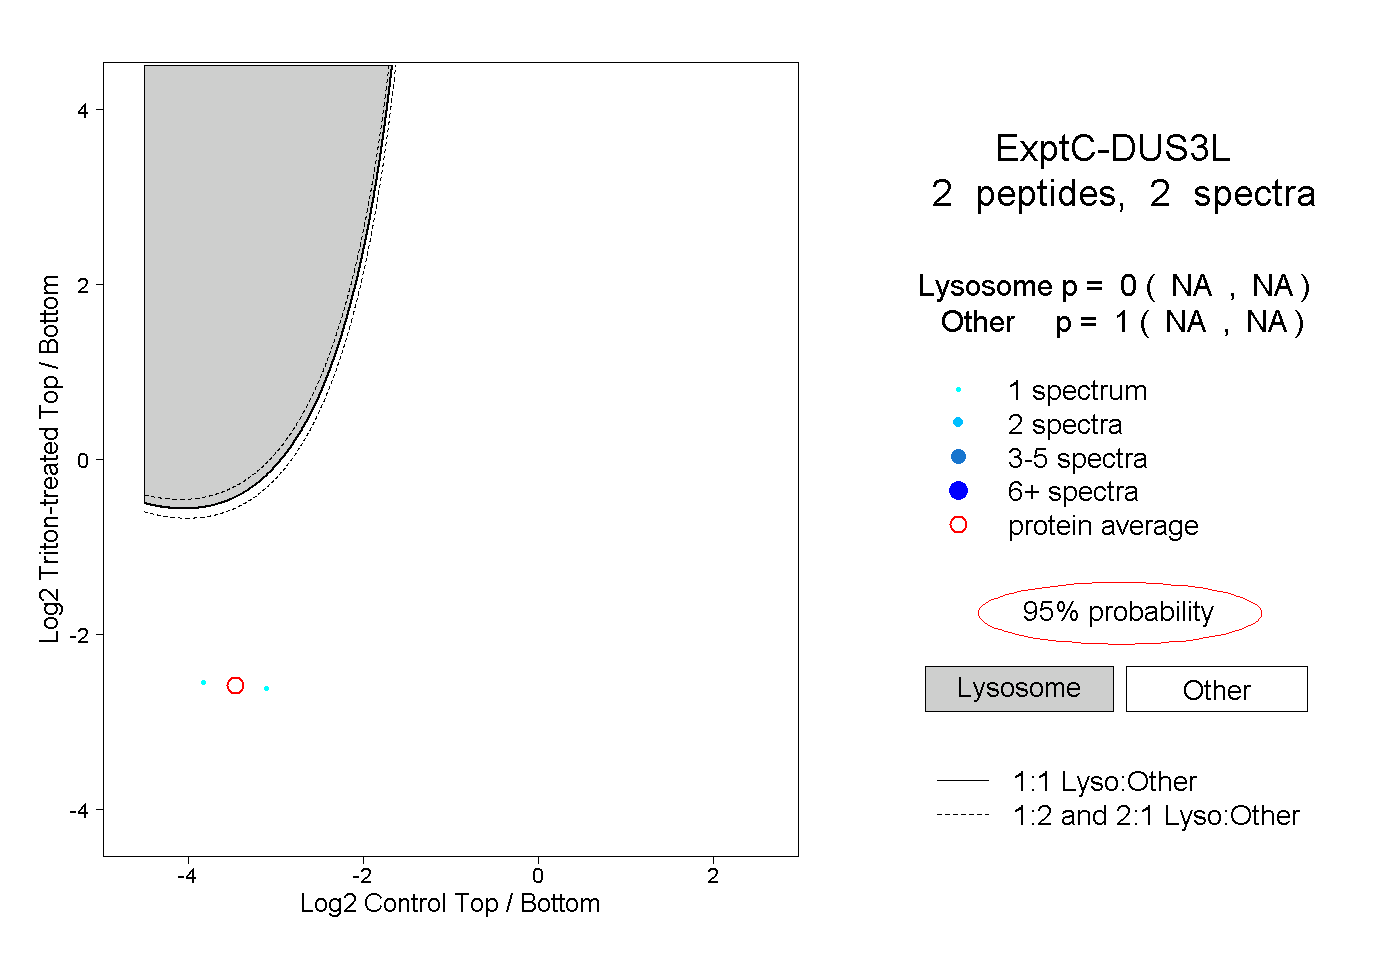 |
0.000 NA | NA |
1.000 NA | NA |