13
13peptides
spectra
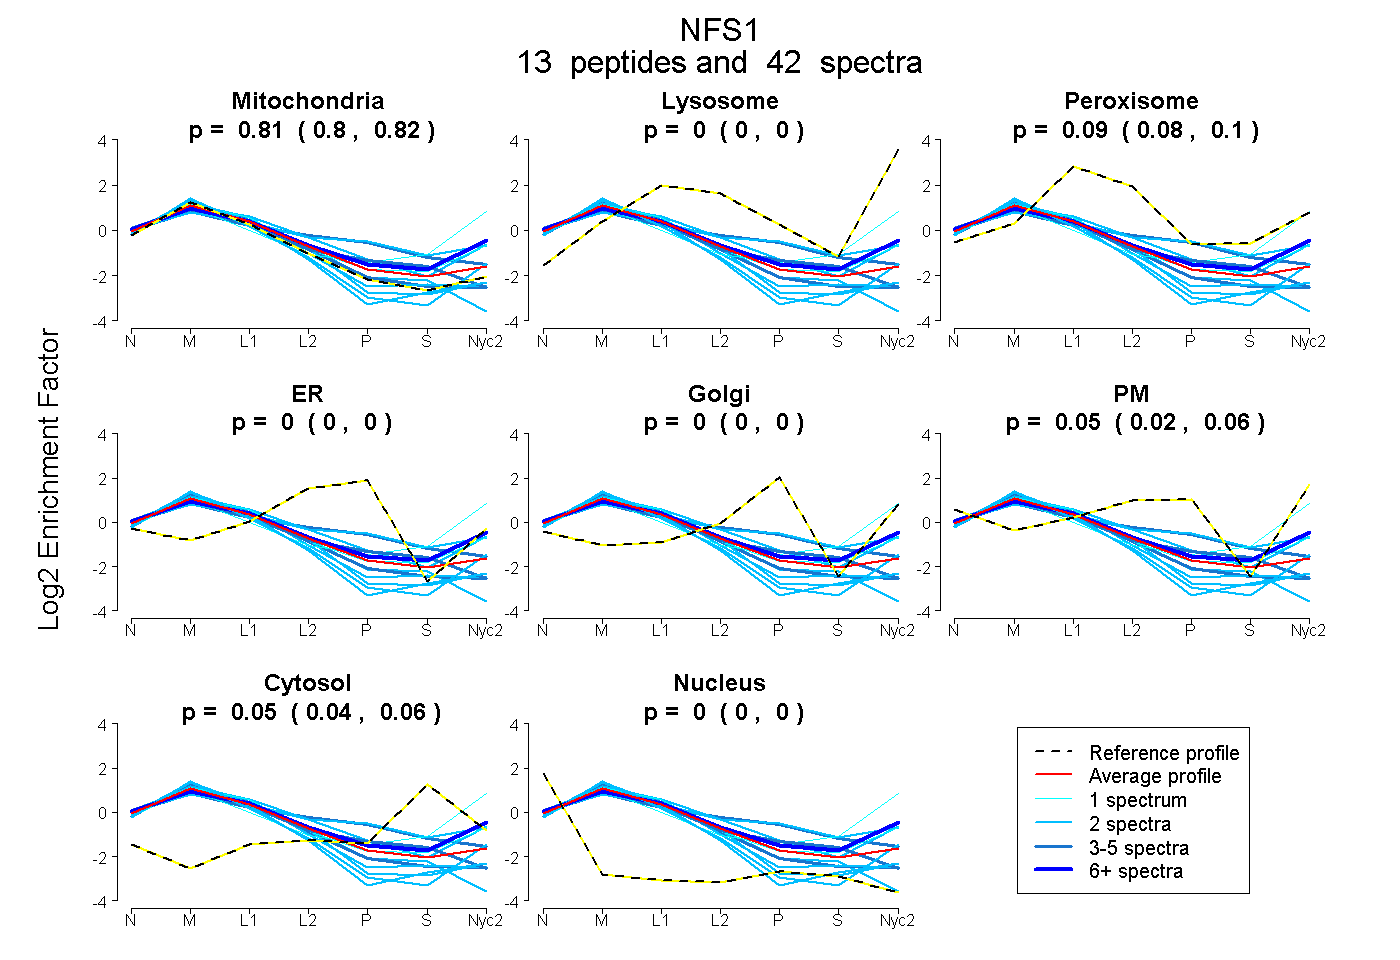
0.801 | 0.824
0.000 | 0.000
0.083 | 0.099
0.000 | 0.003
0.000 | 0.000
0.025 | 0.059
0.042 | 0.055
0.000 | 0.003
12peptides
spectra
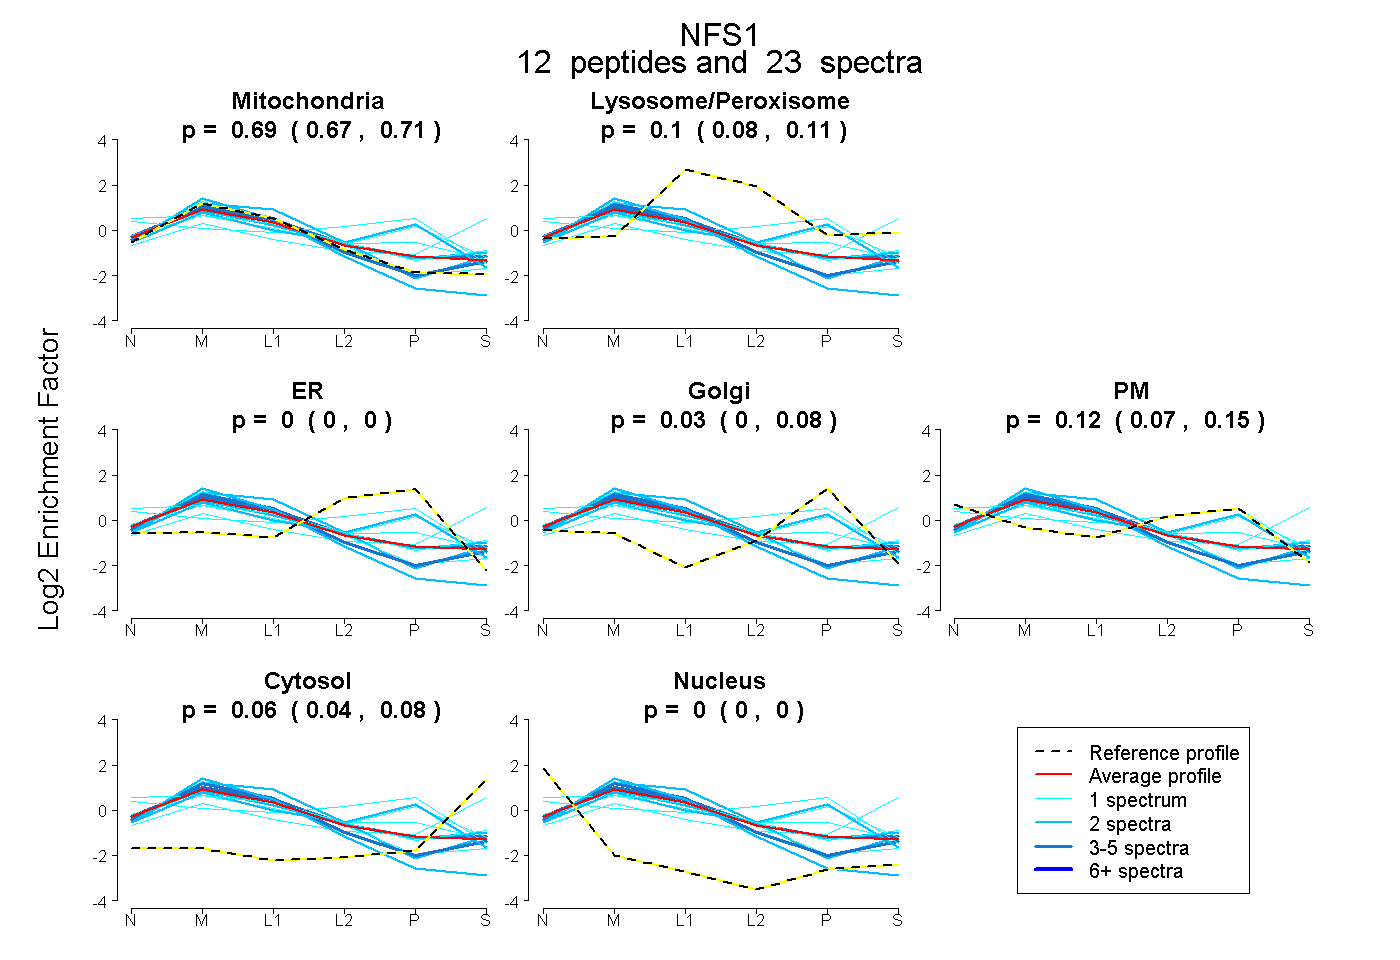
0.667 | 0.711
0.078 | 0.112
0.000 | 0.000
0.000 | 0.078
0.074 | 0.149
0.041 | 0.076
0.000 | 0.000
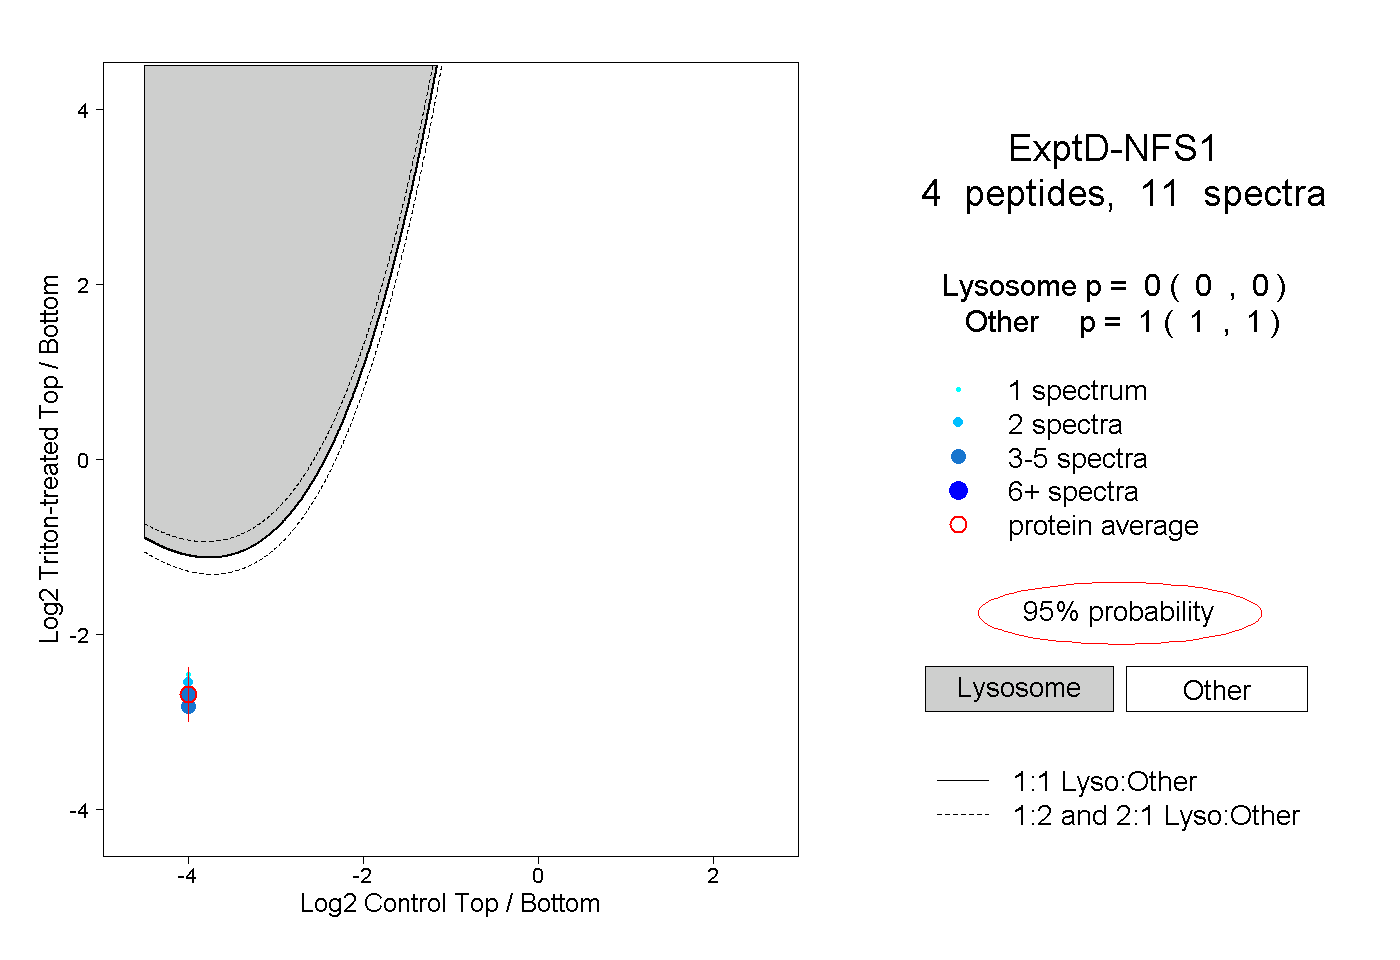
18peptides
spectra
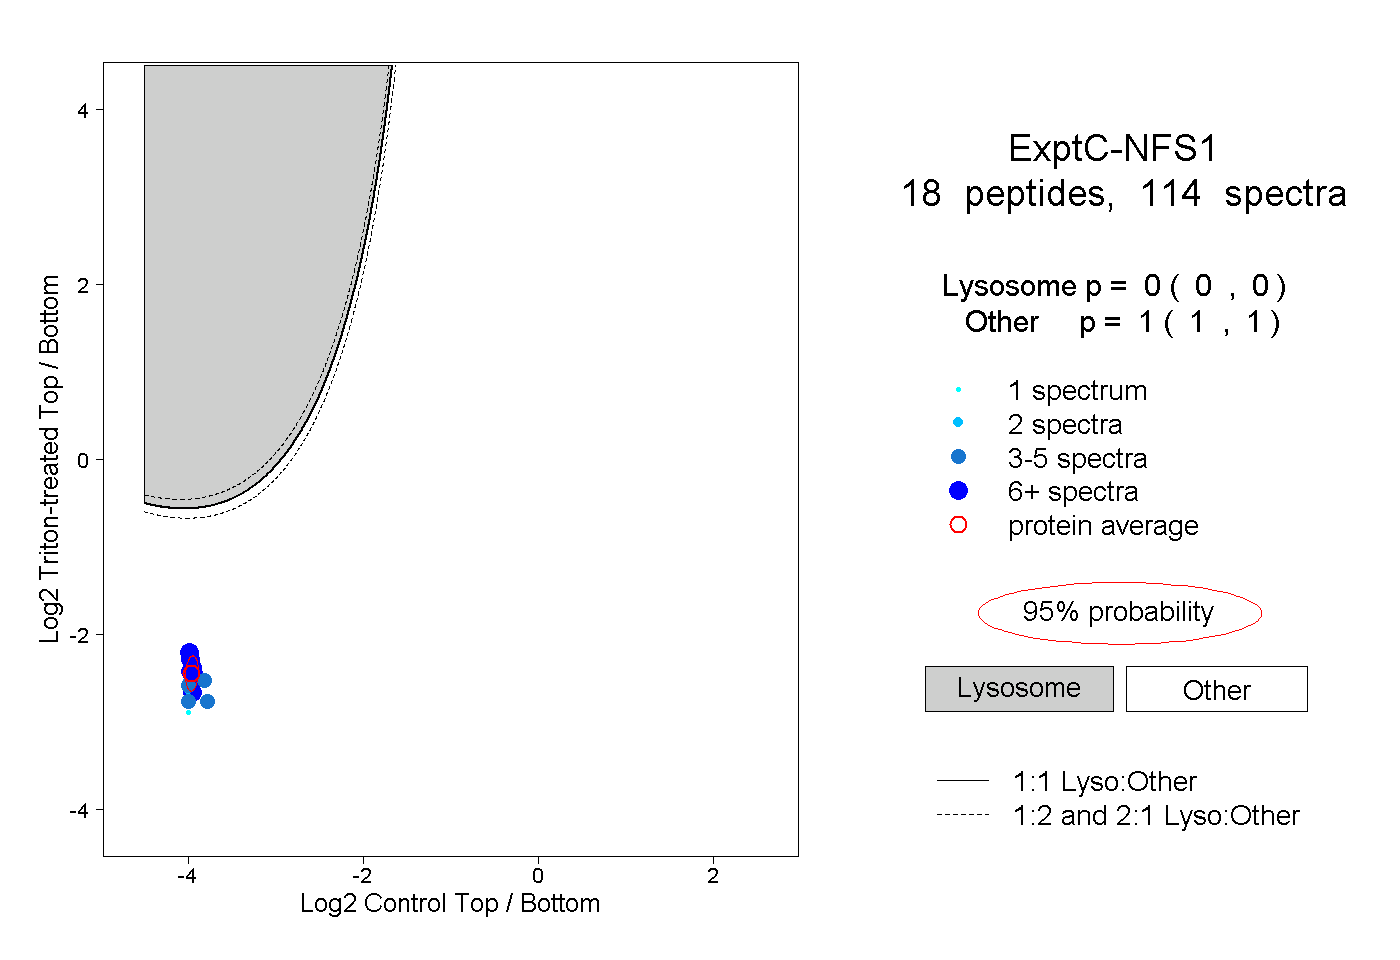
0.000 | 0.000
1.000 | 1.000