 13
13peptides
spectra
0.801 | 0.824
0.000 | 0.000
0.083 | 0.099
0.000 | 0.003
0.000 | 0.000
0.025 | 0.059
0.042 | 0.055
0.000 | 0.003
| Plot | Mito | Lyso | Perox | ER | Golgi | PM | Cytosol | Nucleus | |||||
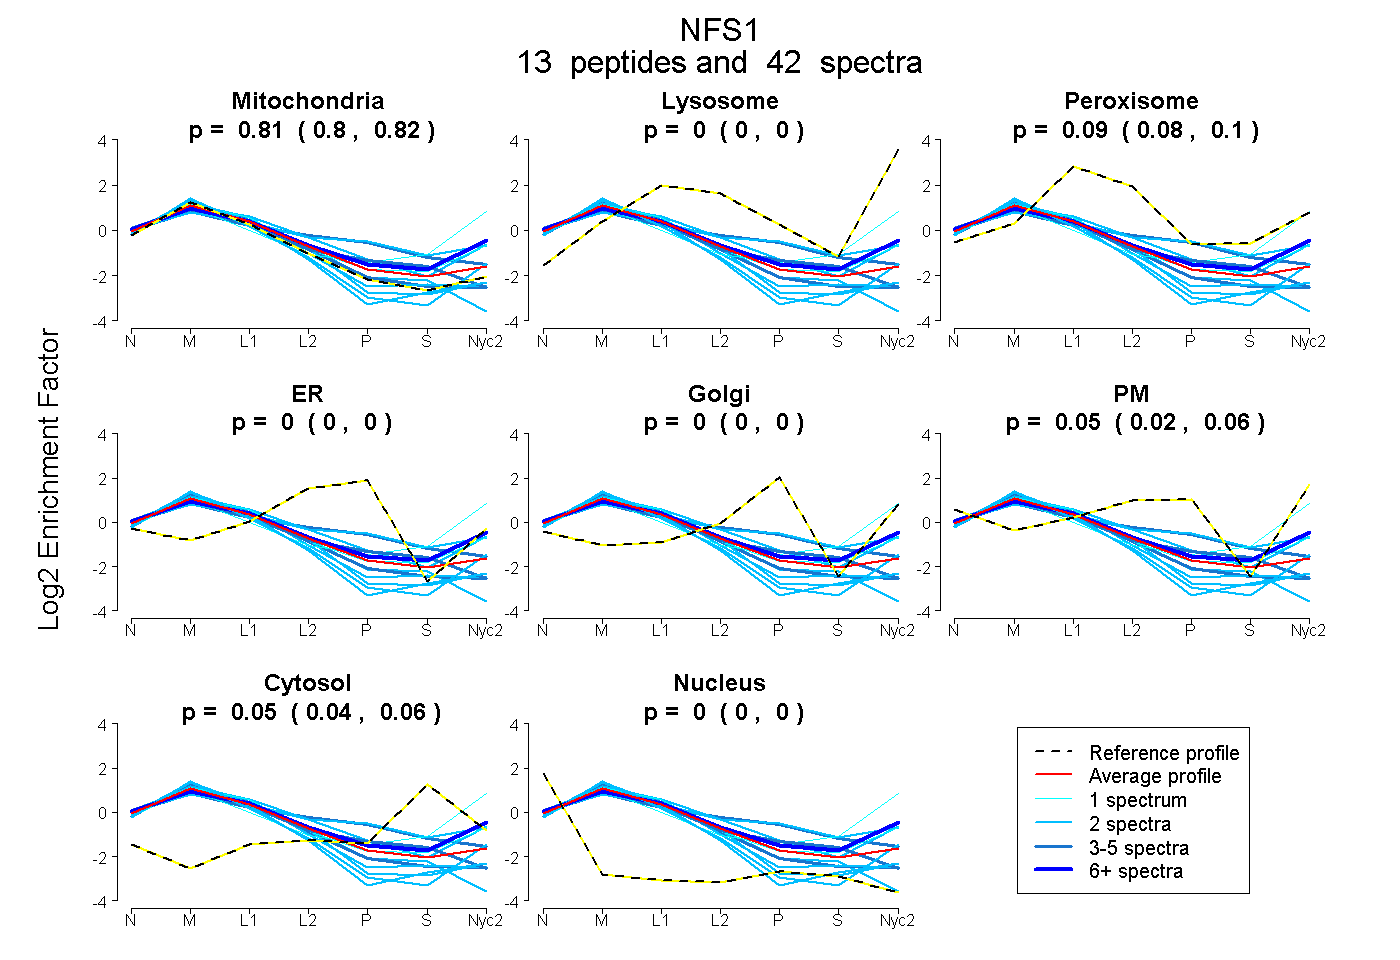
| Expt A |
13 peptides |
42 spectra |
|
0.815 0.801 | 0.824 |
0.000 0.000 | 0.000 |
0.091 0.083 | 0.099 |
0.000 0.000 | 0.003 |
0.000 0.000 | 0.000 |
0.045 0.025 | 0.059 |
0.049 0.042 | 0.055 |
0.000 0.000 | 0.003 |
| 2 spectra, VEALQSGGGQER | 1.000 | 0.000 | 0.000 | 0.000 | 0.000 | 0.000 | 0.000 | 0.000 | ||
| 16 spectra, SLEAEGFR | 0.660 | 0.143 | 0.018 | 0.000 | 0.000 | 0.101 | 0.077 | 0.000 | ||
| 2 spectra, FTTEEEVDYTVQK | 0.452 | 0.000 | 0.218 | 0.000 | 0.139 | 0.084 | 0.107 | 0.000 | ||
| 3 spectra, QQVASLIGADPR | 0.808 | 0.000 | 0.013 | 0.071 | 0.000 | 0.000 | 0.106 | 0.003 | ||
| 2 spectra, SGIIDLK | 0.969 | 0.000 | 0.000 | 0.000 | 0.000 | 0.000 | 0.000 | 0.031 | ||
| 4 spectra, CVLDSCR | 0.984 | 0.000 | 0.011 | 0.000 | 0.000 | 0.000 | 0.000 | 0.005 | ||
| 3 spectra, AIGTDEDLAHSSIR | 0.541 | 0.000 | 0.126 | 0.202 | 0.000 | 0.000 | 0.131 | 0.000 | ||
| 2 spectra, CIHHVK | 0.951 | 0.000 | 0.000 | 0.000 | 0.000 | 0.000 | 0.000 | 0.049 | ||
| 1 spectrum, QPIAEIGQICSSR | 0.448 | 0.364 | 0.000 | 0.000 | 0.000 | 0.000 | 0.131 | 0.057 | ||
| 2 spectra, EIIFTSGATESNNIAIK | 0.651 | 0.048 | 0.117 | 0.000 | 0.000 | 0.184 | 0.000 | 0.000 | ||
| 2 spectra, IPLDVNDMK | 0.989 | 0.000 | 0.000 | 0.000 | 0.000 | 0.000 | 0.000 | 0.011 | ||
| 1 spectrum, LYFHTDAAQAVGK | 0.733 | 0.175 | 0.037 | 0.000 | 0.000 | 0.000 | 0.038 | 0.018 | ||
| 2 spectra, HLVTTQTEHK | 1.000 | 0.000 | 0.000 | 0.000 | 0.000 | 0.000 | 0.000 | 0.000 |
| Plot | Mito | Lyso or Perox | ER | Golgi | PM | Cytosol | Nucleus | ||||||
| Expt B |
12 peptides |
23 spectra |
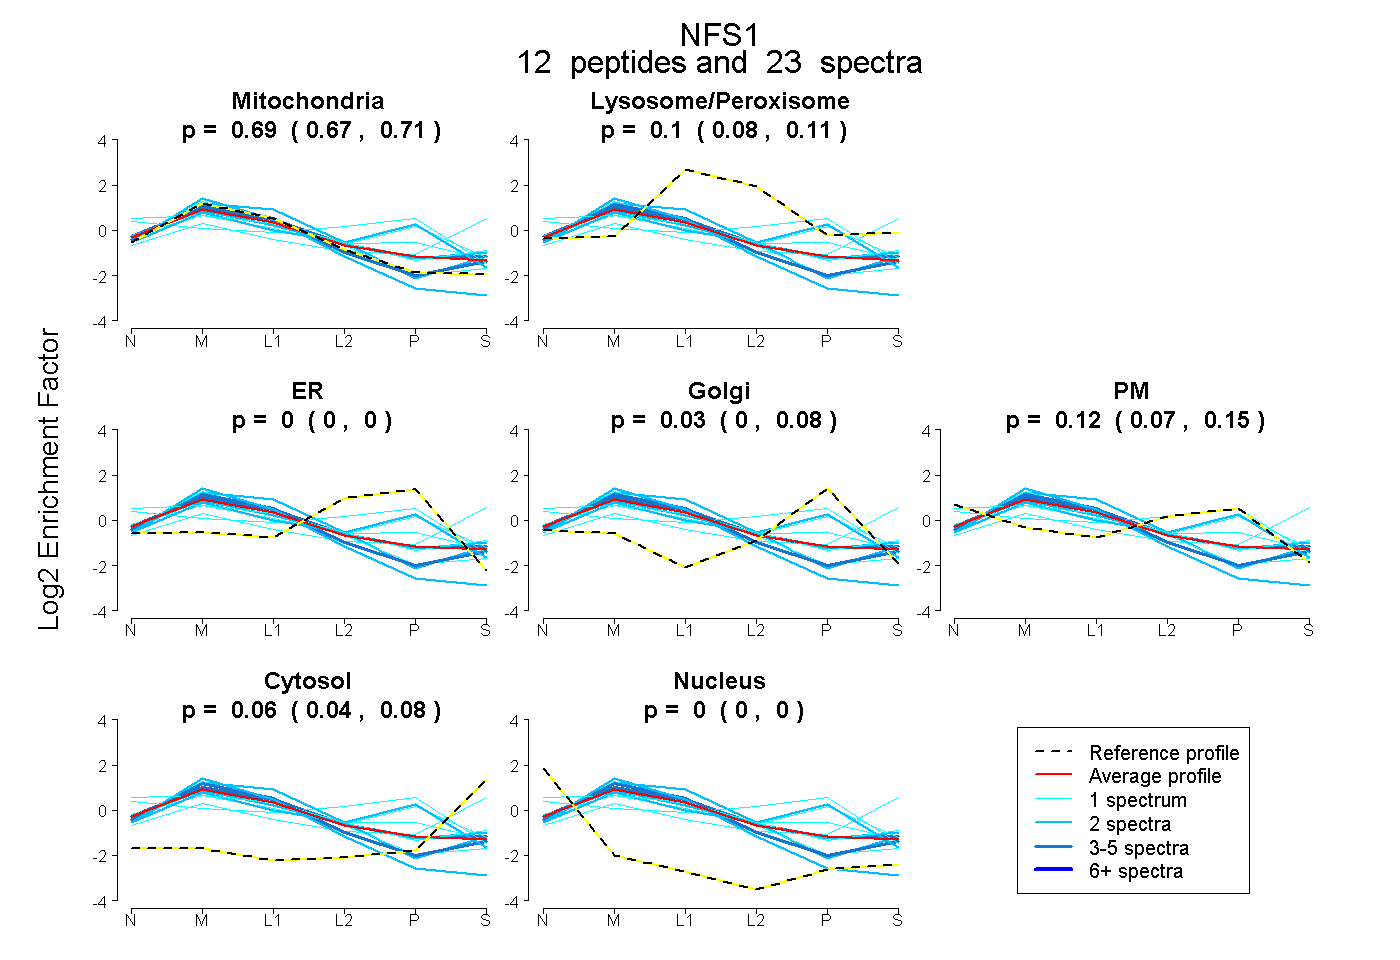 |
0.690 0.667 | 0.711 |
0.096 0.078 | 0.112 |
0.000 0.000 | 0.000 |
0.034 0.000 | 0.078 |
0.118 0.074 | 0.149 |
0.061 0.041 | 0.076 |
0.000 0.000 | 0.000 |
|||
| Plot | Lyso | Other | |||||||||||
| Expt C |
18 peptides |
114 spectra |
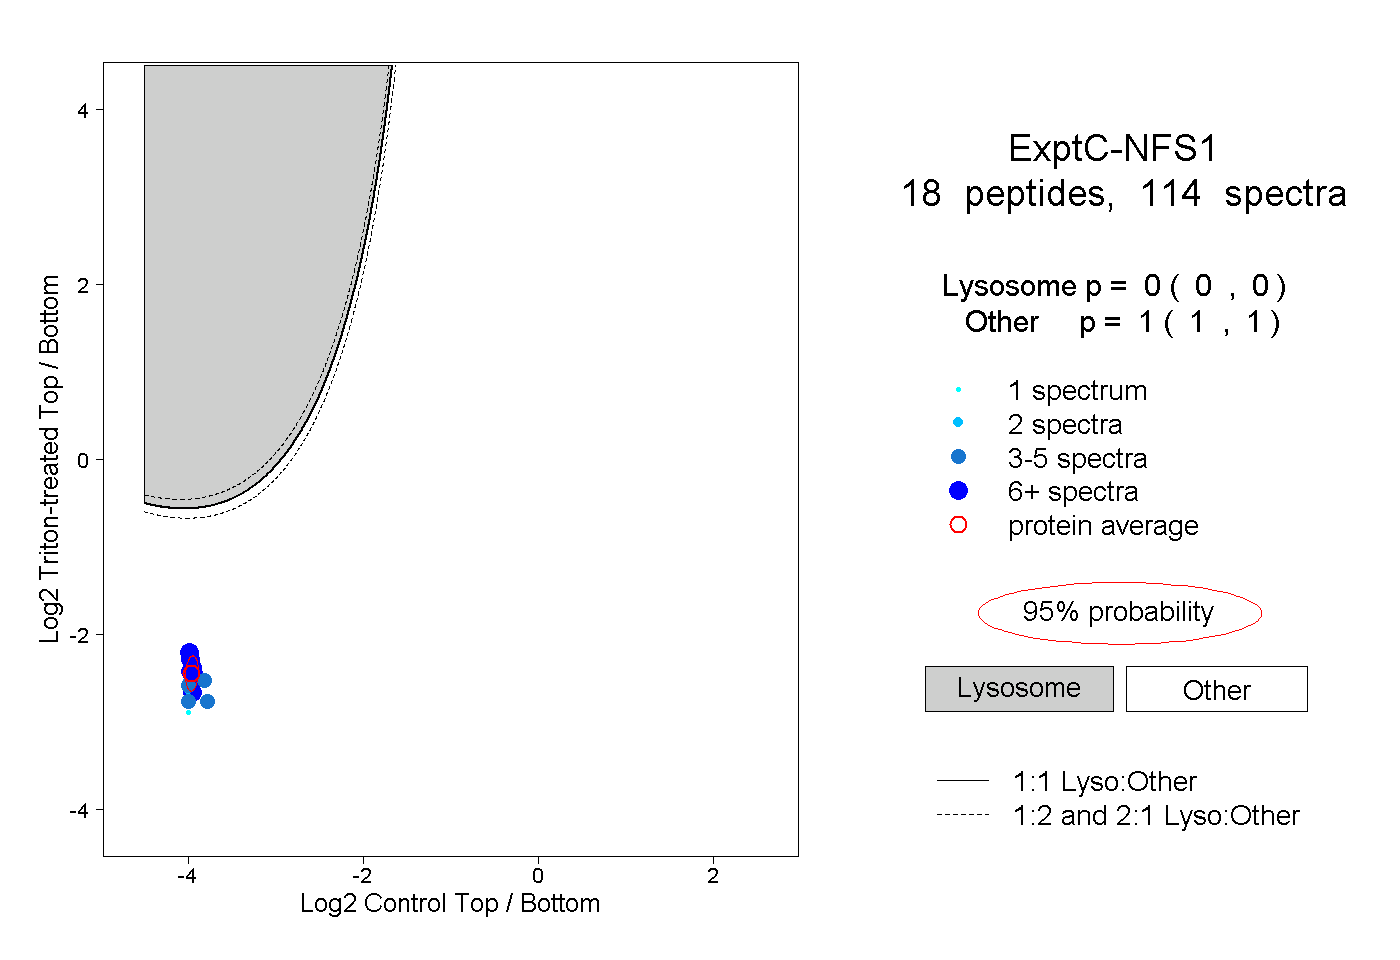 |
0.000 0.000 | 0.000 |
1.000 1.000 | 1.000 |
||||||||
| Plot | Lyso | Other | |||||||||||
| Expt D |
4 peptides |
11 spectra |
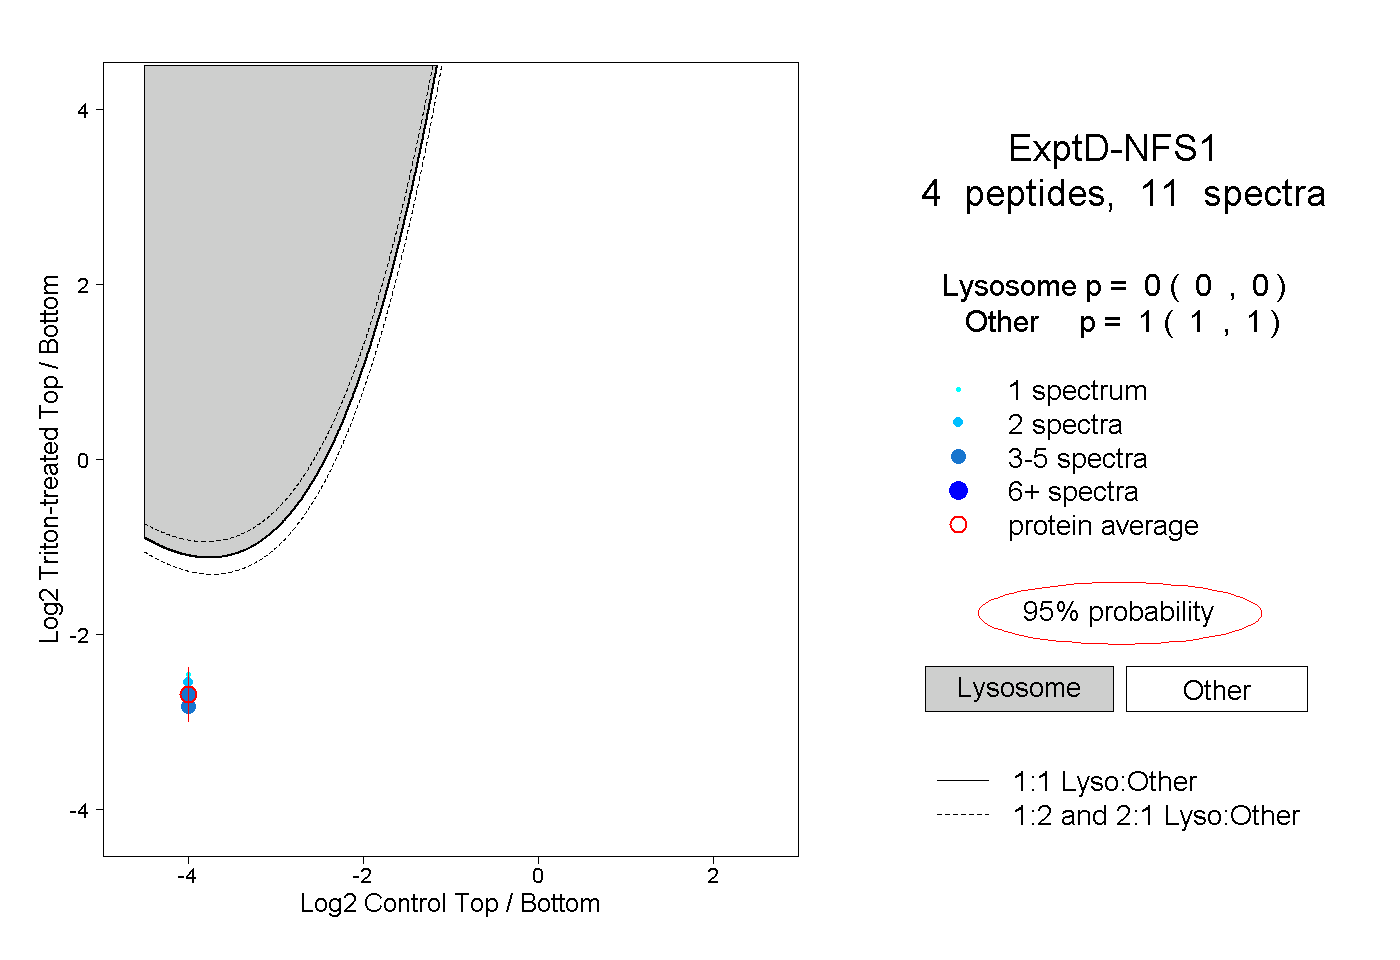 |
0.000 0.000 | 0.000 |
1.000 1.000 | 1.000 |