 4
4peptides
spectra
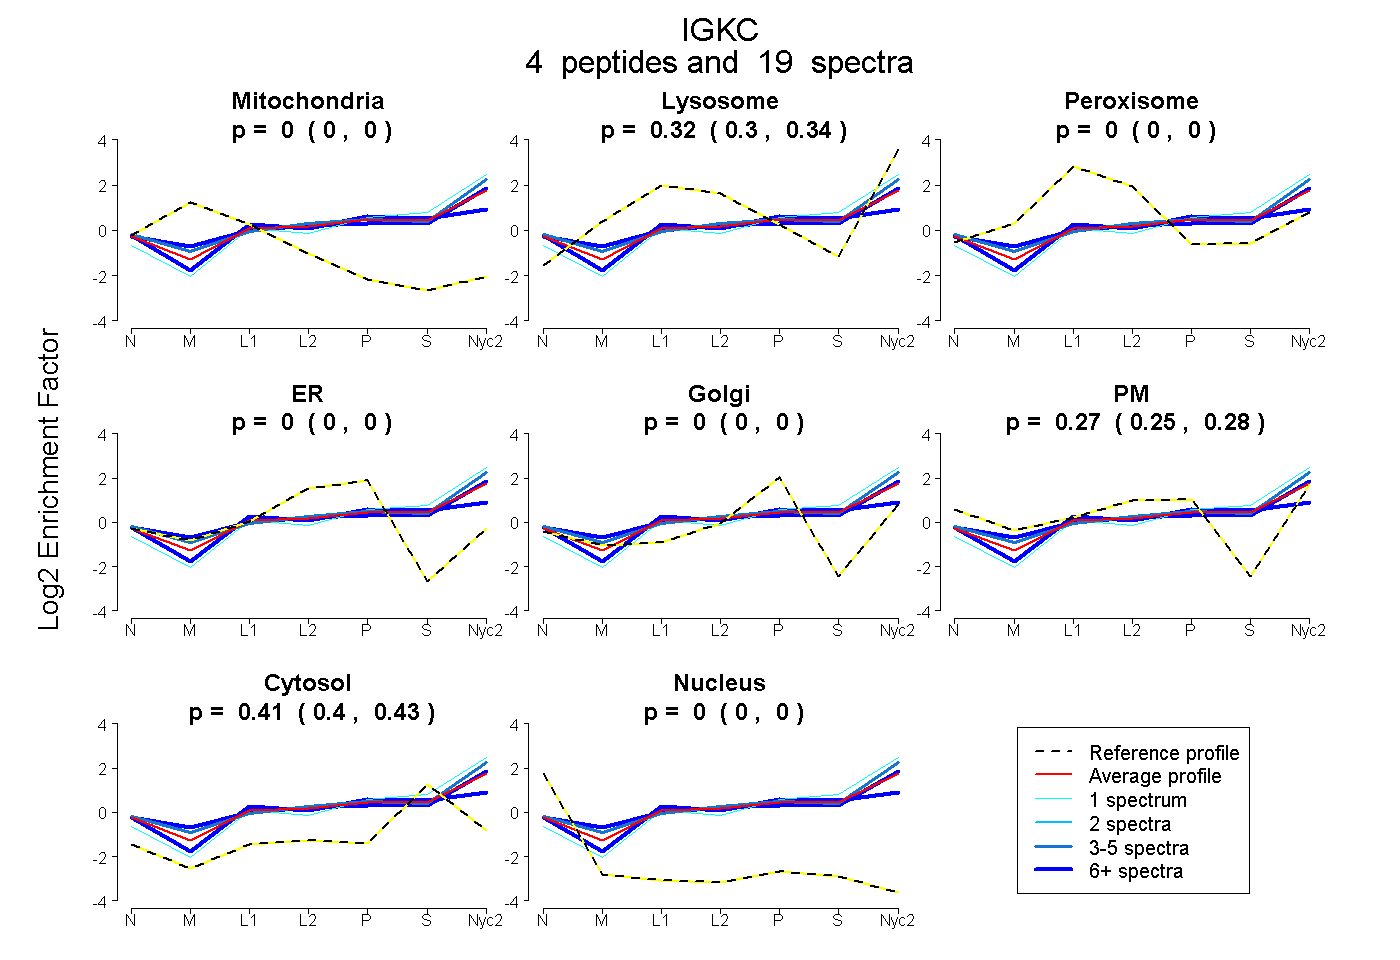
0.000 | 0.000
0.296 | 0.339
0.000 | 0.000
0.000 | 0.000
0.000 | 0.000
0.252 | 0.279
0.400 | 0.425
0.000 | 0.000
4peptides
spectra
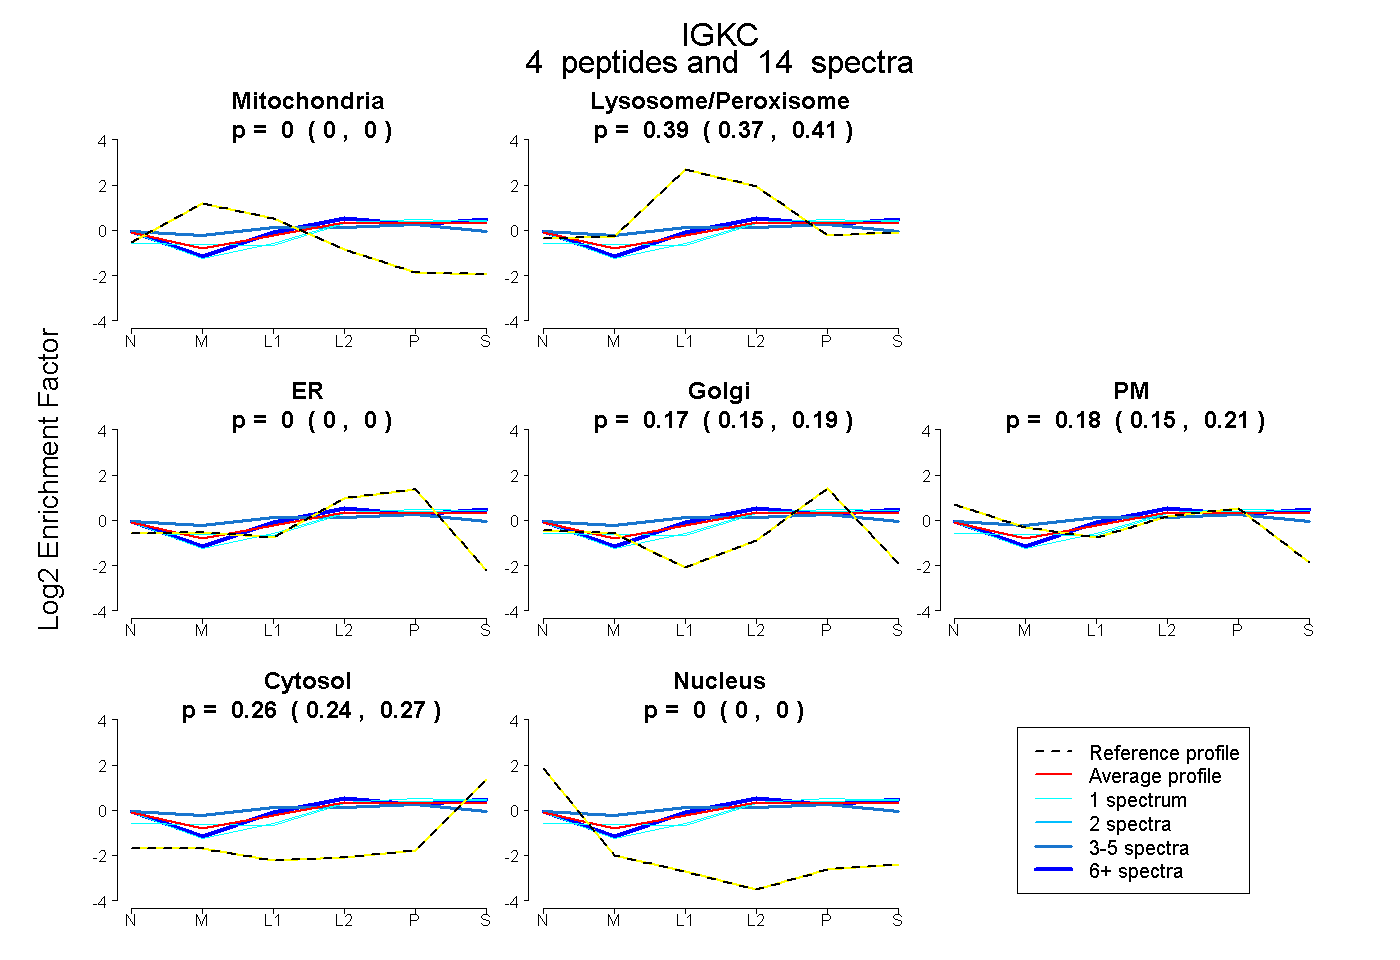
0.000 | 0.000
0.371 | 0.408
0.000 | 0.000
0.148 | 0.187
0.153 | 0.210
0.243 | 0.266
0.000 | 0.000
4peptides
spectra
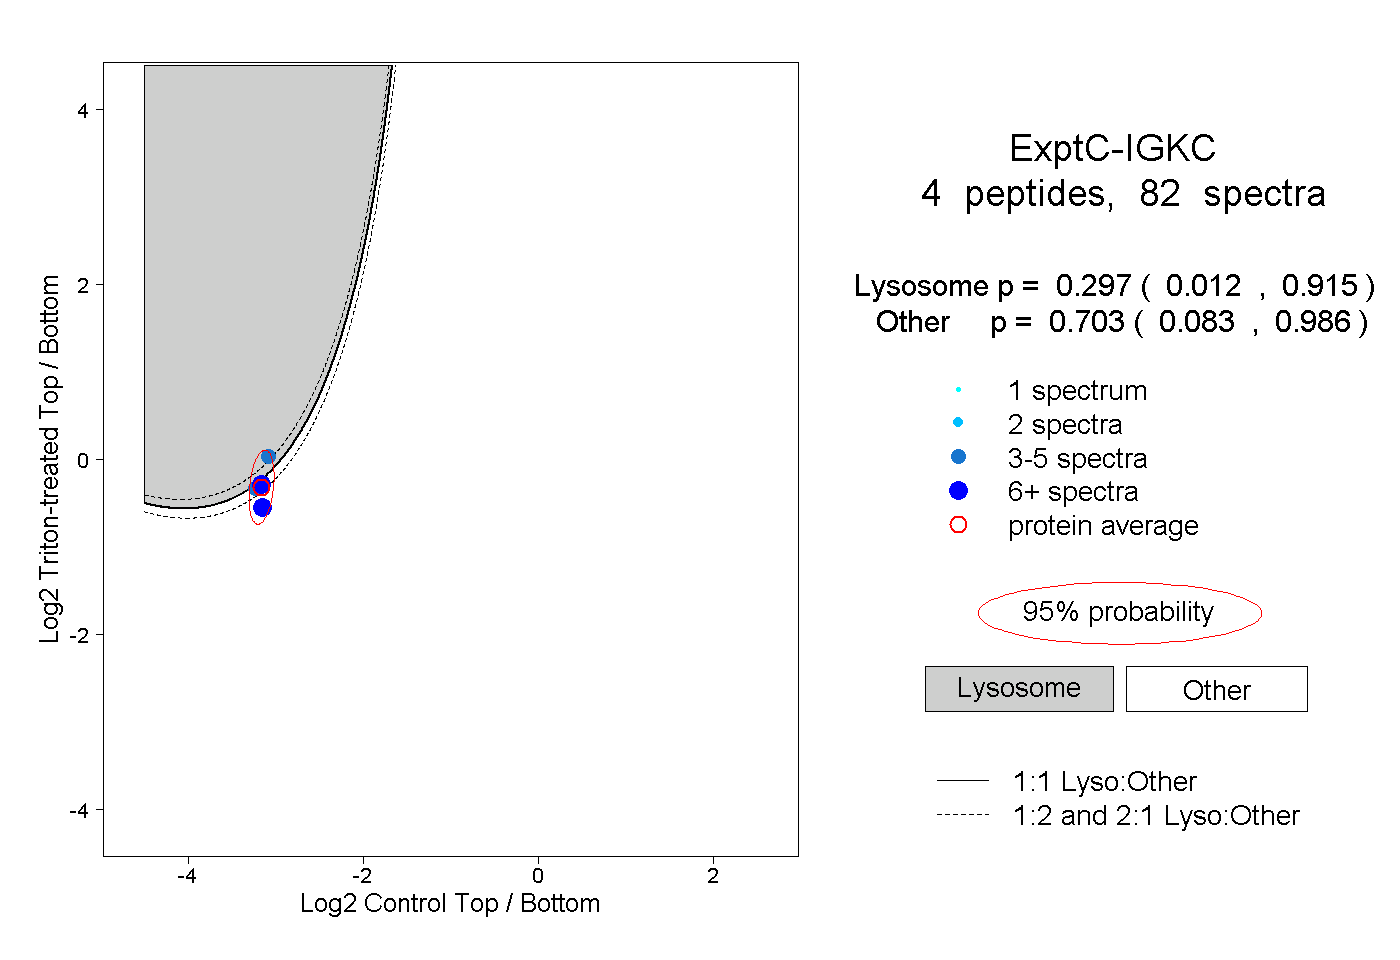
0.012 | 0.915
0.083 | 0.986
2peptides
spectra
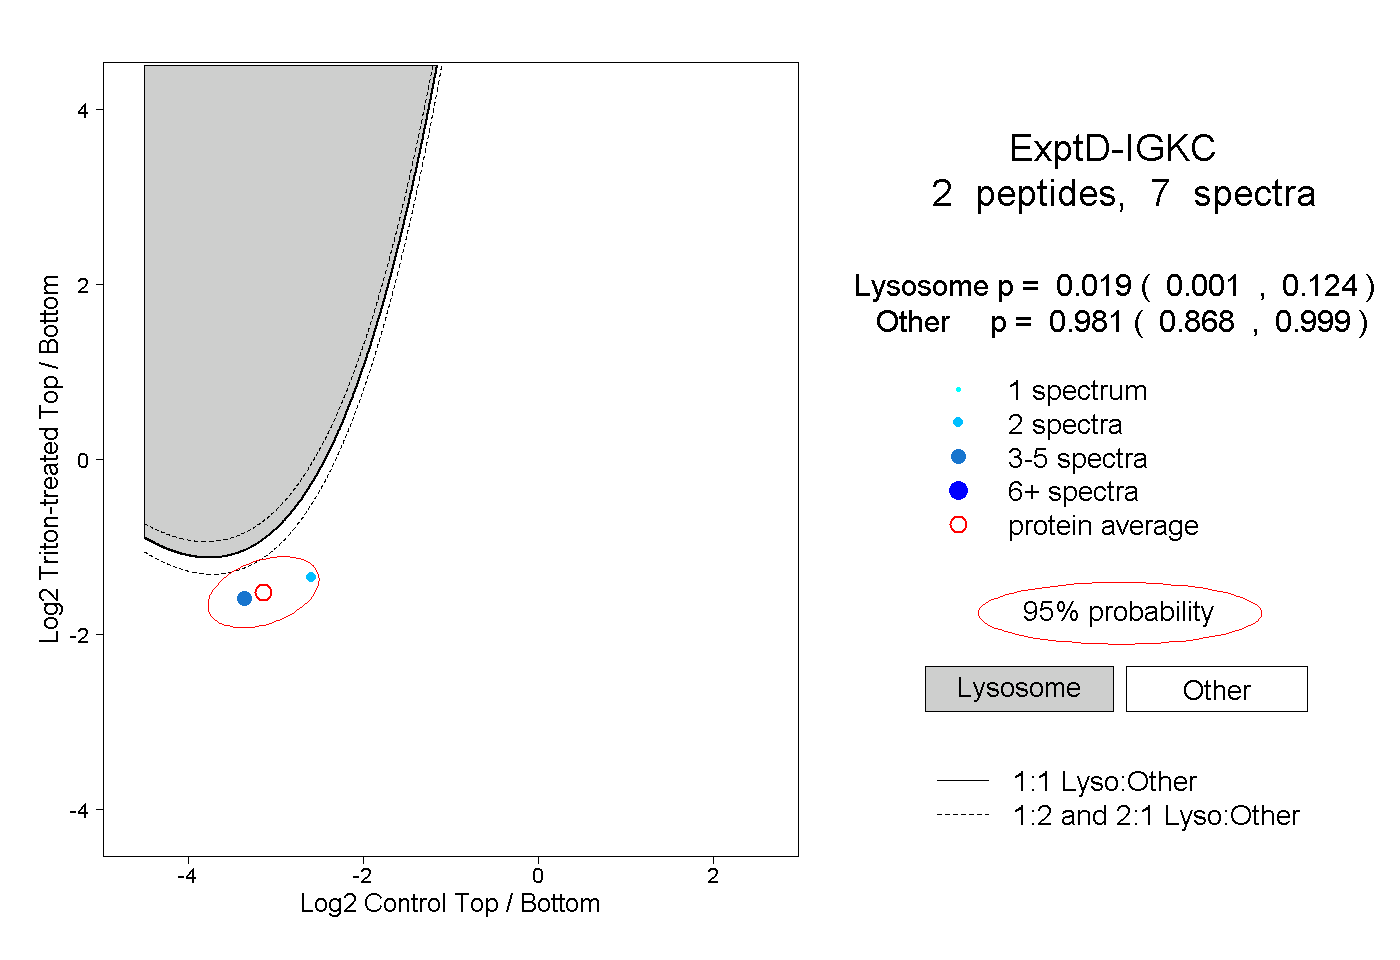
0.001 | 0.124
0.868 | 0.999