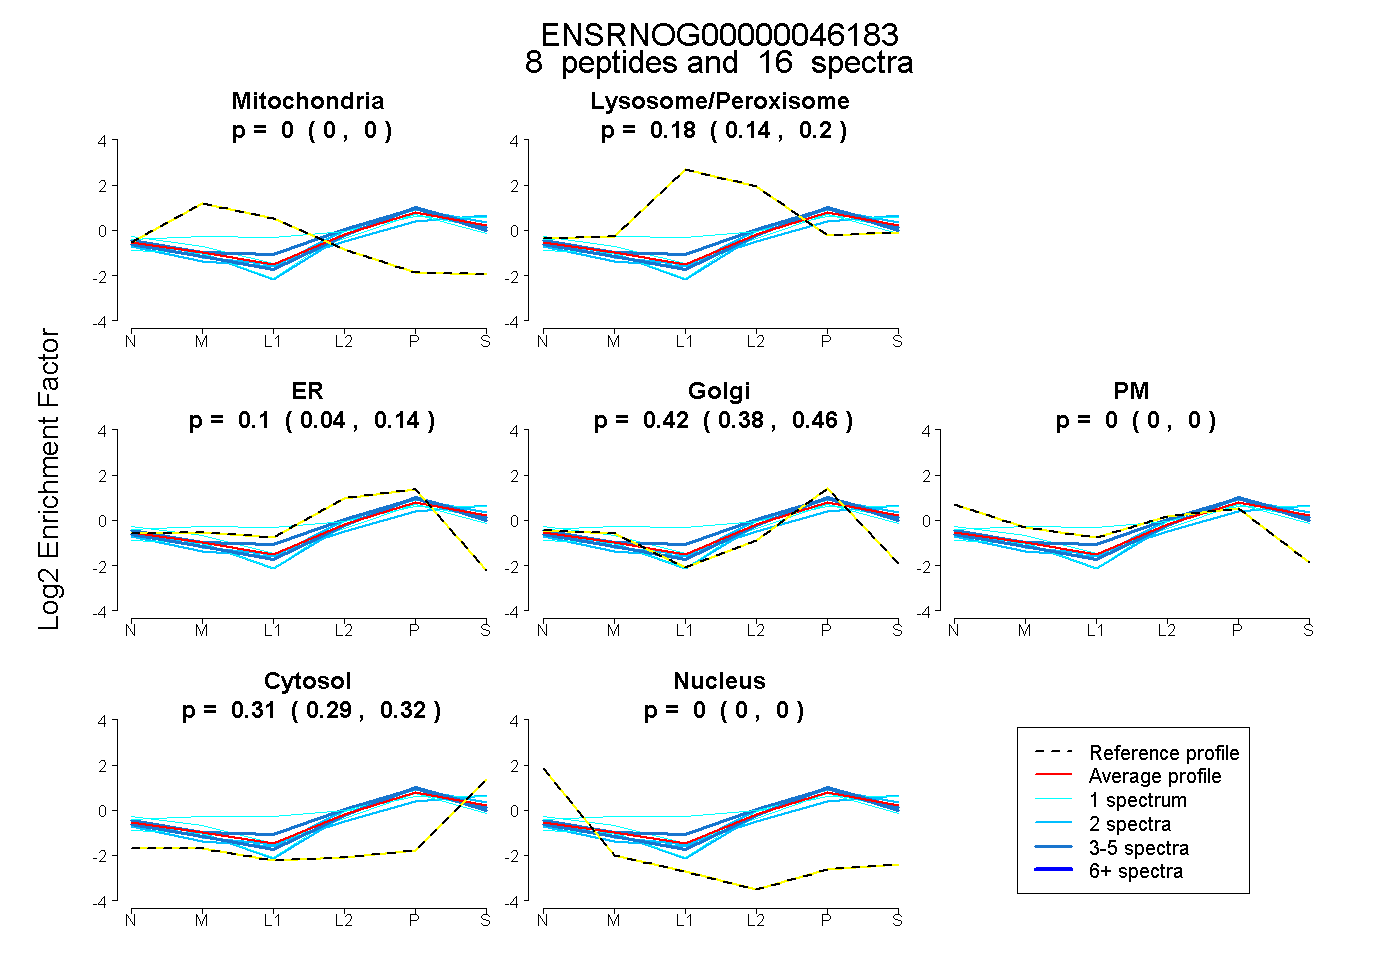
 8
8peptides
spectra
0.000 | 0.000
0.145 | 0.201
0.038 | 0.143
0.378 | 0.459
0.000 | 0.000
0.288 | 0.320
0.000 | 0.000
| Plot | Mito | Lyso or Perox | ER | Golgi | PM | Cytosol | Nucleus | ||||||
| Expt B |
8 peptides |
16 spectra |
|
0.000 0.000 | 0.000 |
0.176 0.145 | 0.201 |
0.096 0.038 | 0.143 |
0.422 0.378 | 0.459 |
0.000 0.000 | 0.000 |
0.306 0.288 | 0.320 |
0.000 0.000 | 0.000 |
| 2 spectra, FLLQDTVELR | 0.000 | 0.064 | 0.410 | 0.130 | 0.000 | 0.396 | 0.000 | |||
| 1 spectrum, SYLAQFAAR | 0.000 | 0.390 | 0.000 | 0.462 | 0.000 | 0.148 | 0.000 | |||
| 2 spectra, LEVDIPLVK | 0.000 | 0.194 | 0.000 | 0.390 | 0.000 | 0.416 | 0.000 | |||
| 2 spectra, ASSLISLLK | 0.000 | 0.008 | 0.281 | 0.373 | 0.000 | 0.338 | 0.000 | |||
| 1 spectrum, MLEILEGK | 0.000 | 0.000 | 0.453 | 0.059 | 0.000 | 0.488 | 0.000 | |||
| 4 spectra, LQDEFENR | 0.000 | 0.255 | 0.062 | 0.470 | 0.000 | 0.213 | 0.000 | |||
| 3 spectra, VIILSLDR | 0.000 | 0.082 | 0.227 | 0.364 | 0.000 | 0.327 | 0.000 | |||
| 1 spectrum, GLSFLFPLLK | 0.000 | 0.182 | 0.000 | 0.487 | 0.062 | 0.269 | 0.000 |
| Plot | Lyso | Other | |||||||||||
| Expt D |
4 peptides |
6 spectra |
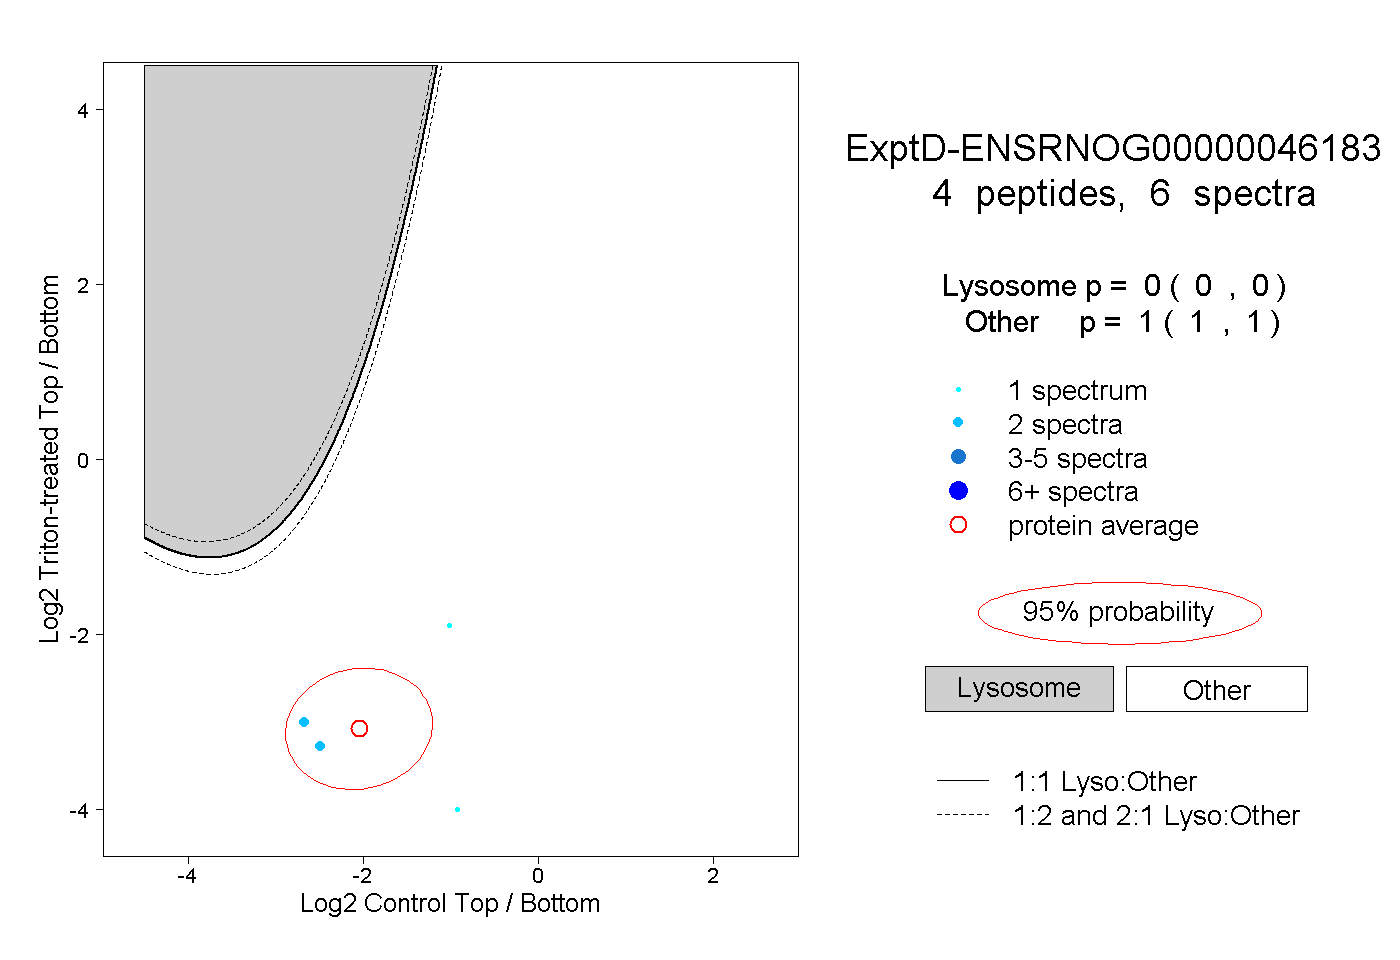 |
0.000 0.000 | 0.000 |
1.000 1.000 | 1.000 |