 6
6peptides
spectra
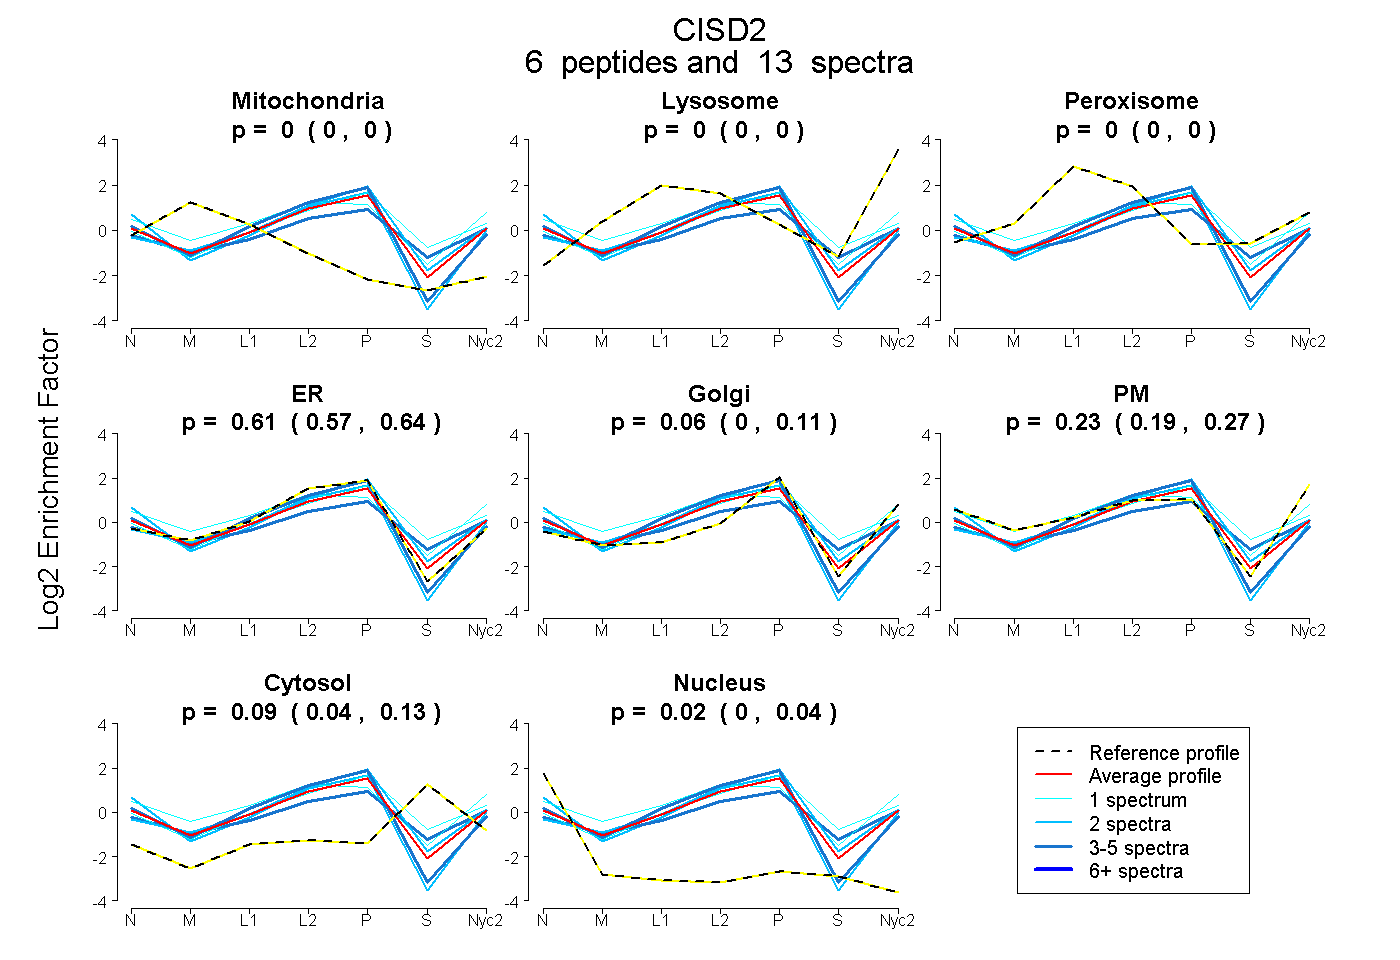
0.000 | 0.000
0.000 | 0.000
0.000 | 0.000
0.567 | 0.637
0.000 | 0.110
0.186 | 0.267
0.036 | 0.126
0.000 | 0.039
3peptides
spectra
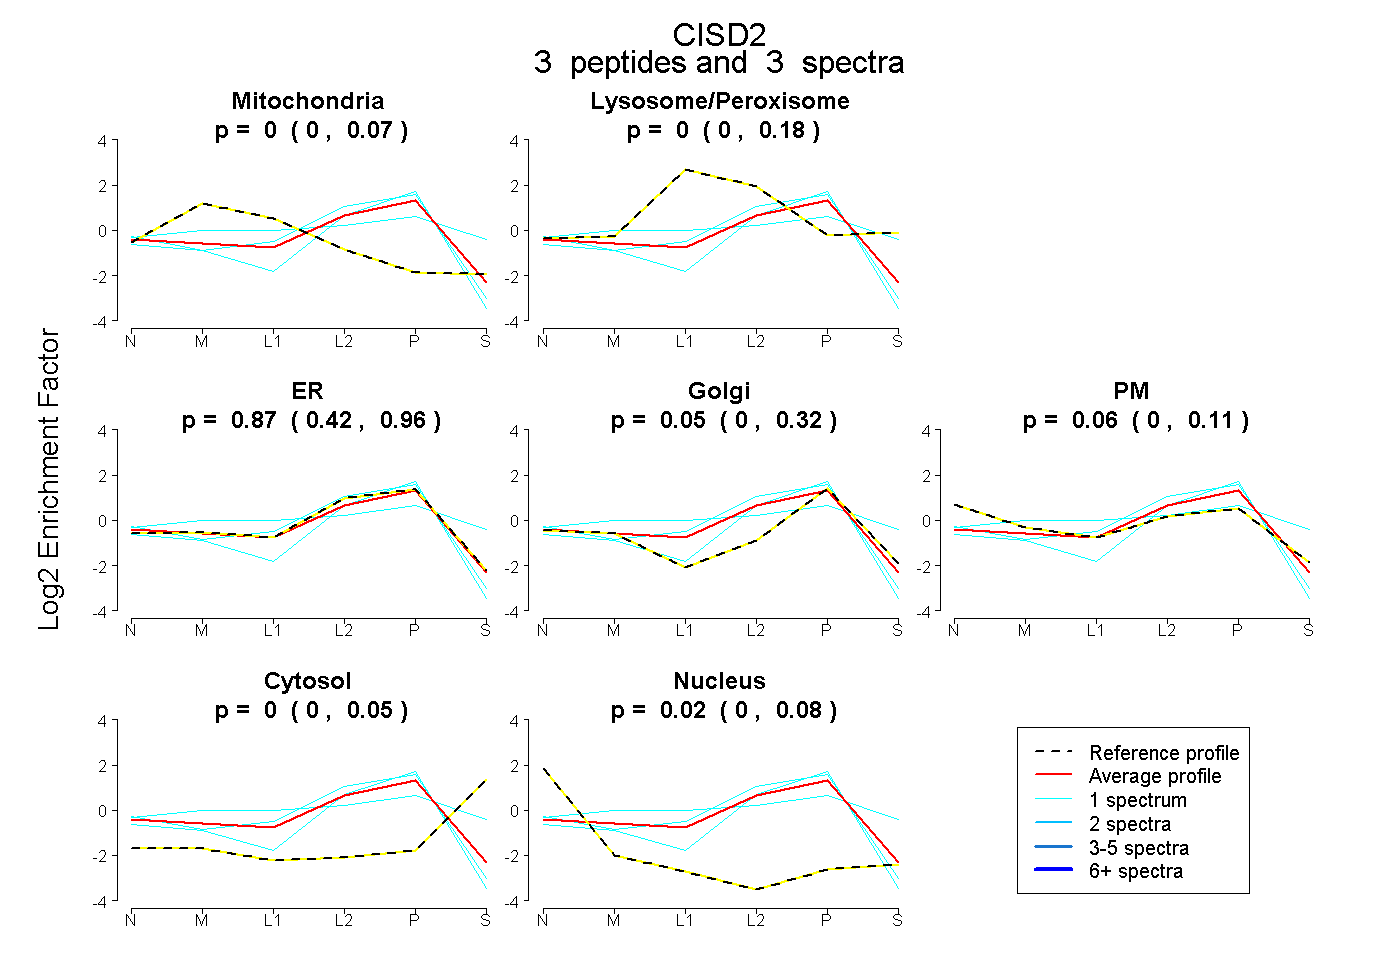
0.000 | 0.067
0.000 | 0.176
0.420 | 0.963
0.000 | 0.317
0.000 | 0.114
0.000 | 0.050
0.000 | 0.077
7peptides
spectra
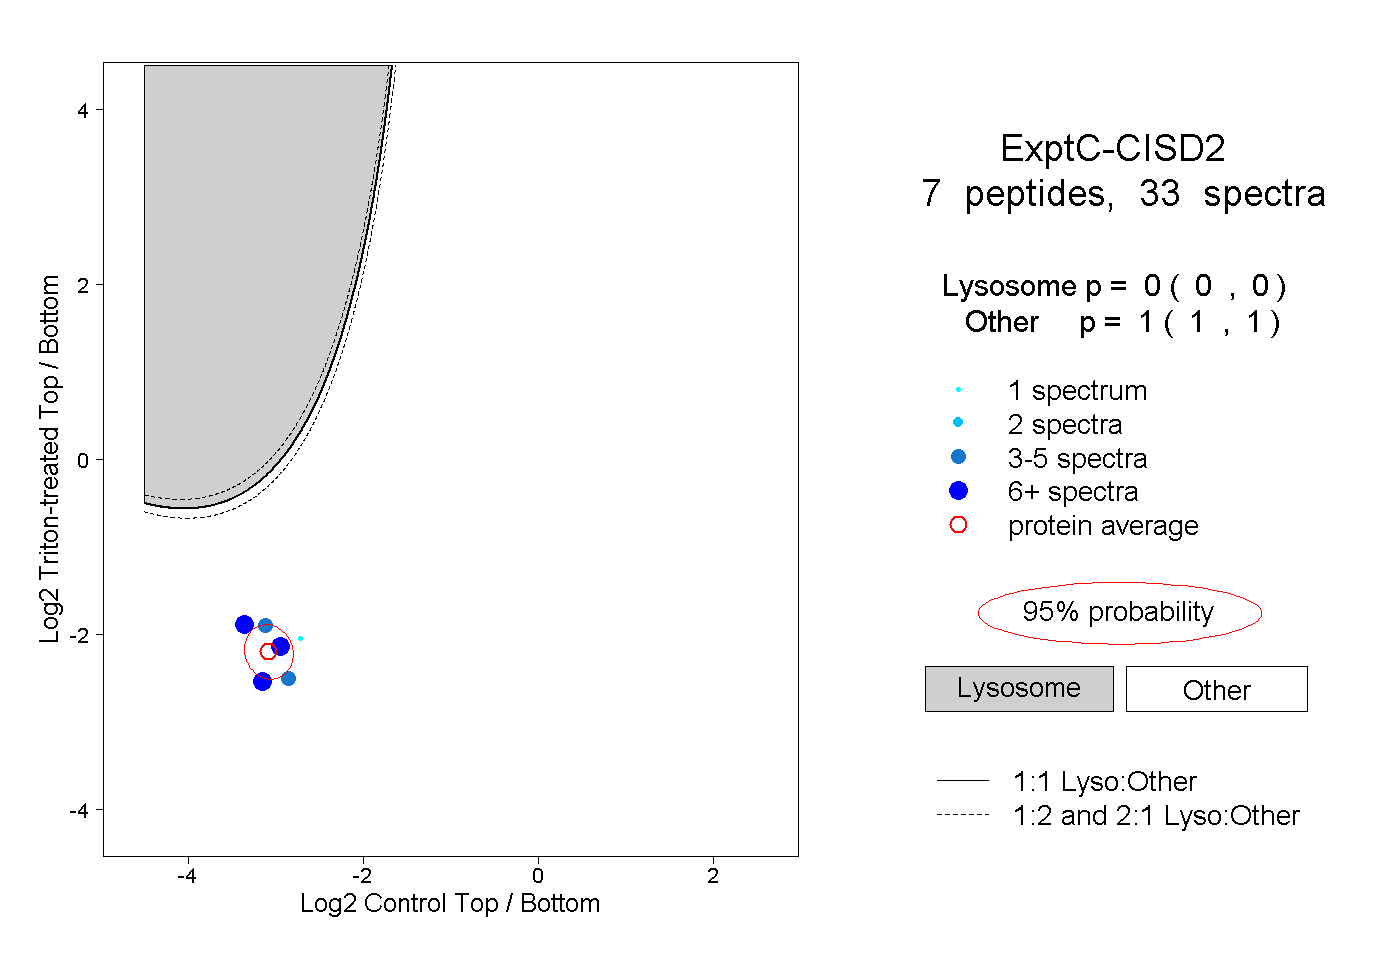
0.000 | 0.000
1.000 | 1.000
3peptides
spectra
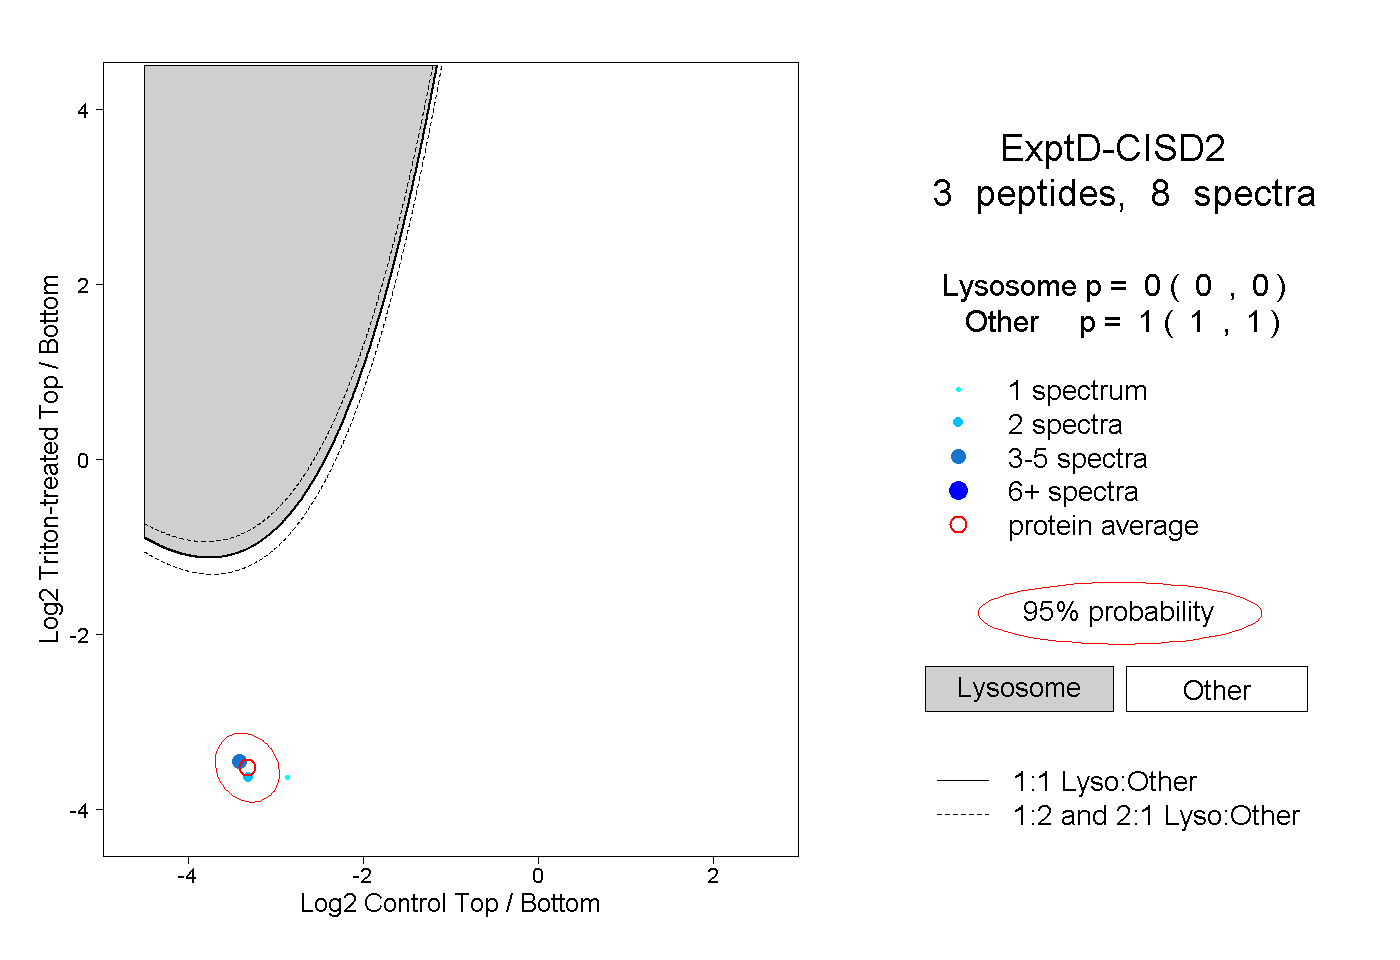
0.000 | 0.000
1.000 | 1.000