 20
20peptides
spectra
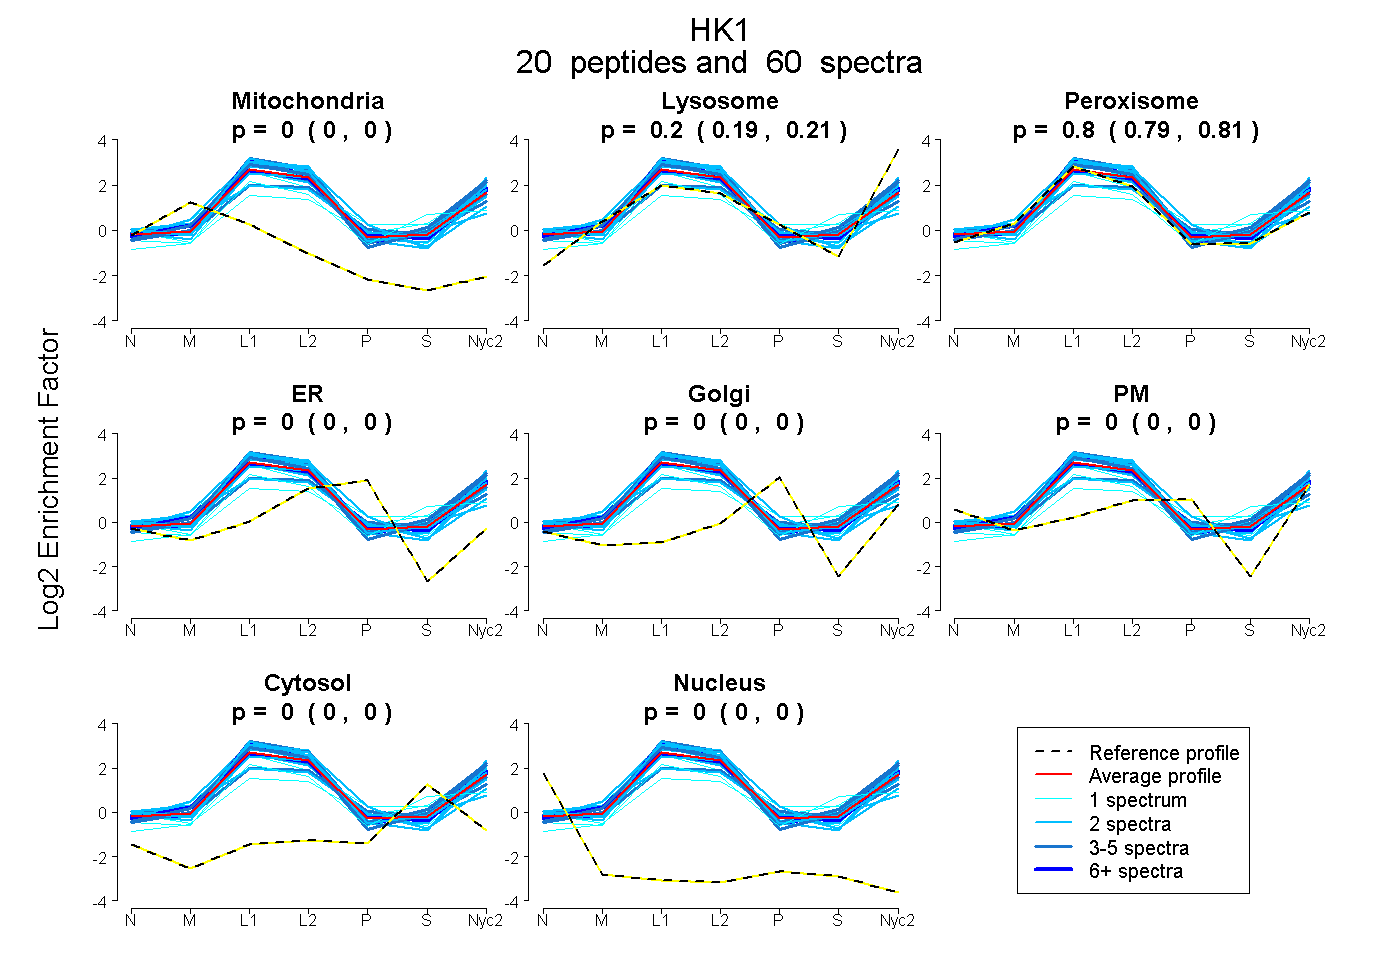
0.000 | 0.000
0.193 | 0.206
0.793 | 0.806
0.000 | 0.000
0.000 | 0.000
0.000 | 0.000
0.000 | 0.000
0.000 | 0.000
6peptides
spectra
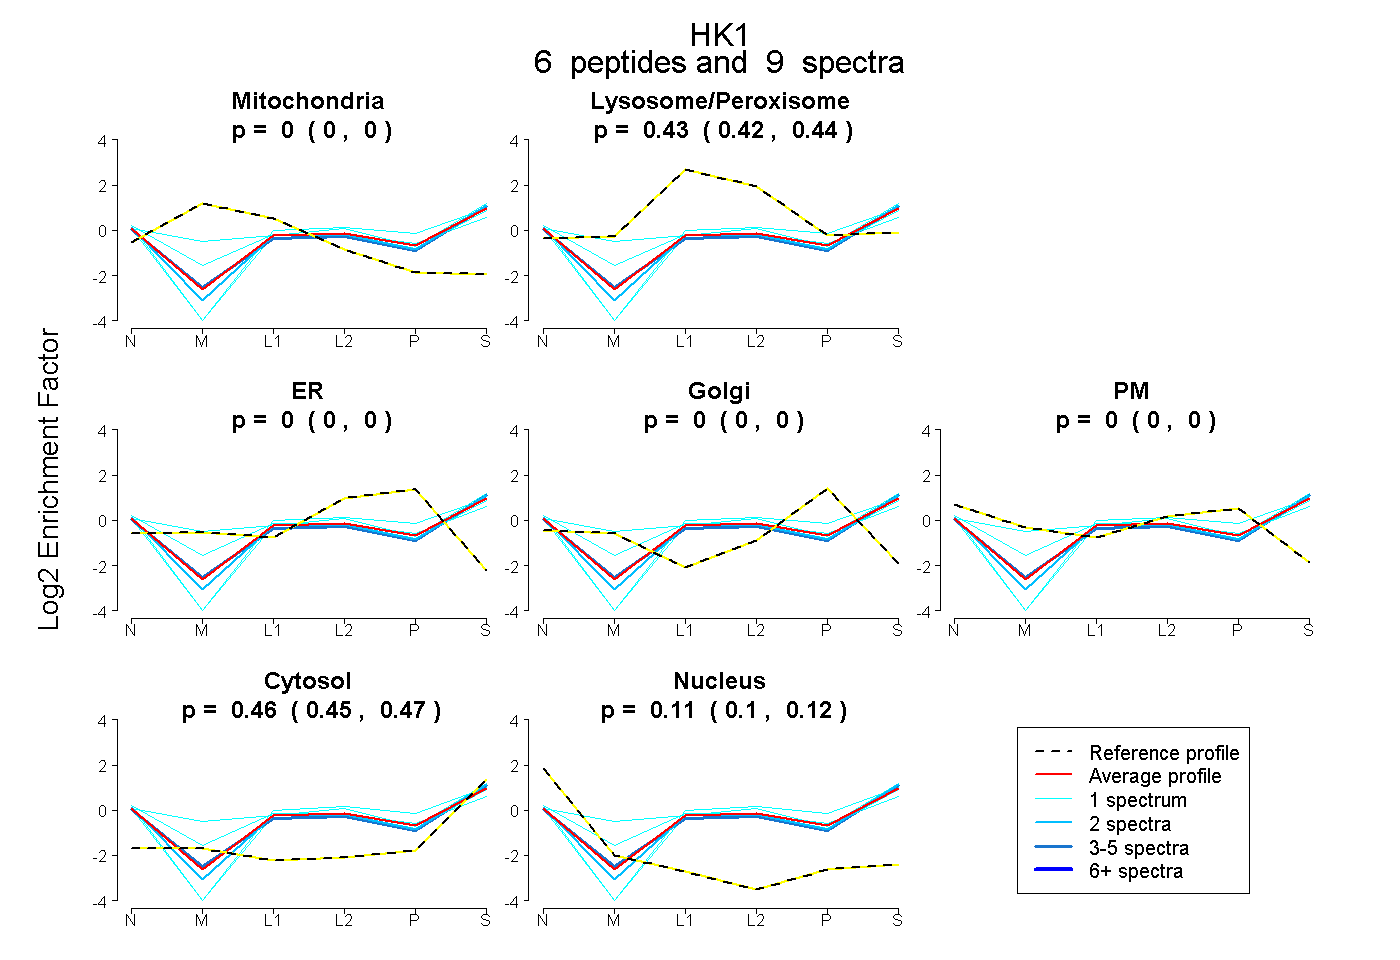
0.000 | 0.000
0.419 | 0.438
0.000 | 0.000
0.000 | 0.000
0.000 | 0.000
0.450 | 0.470
0.100 | 0.116
35peptides
spectra
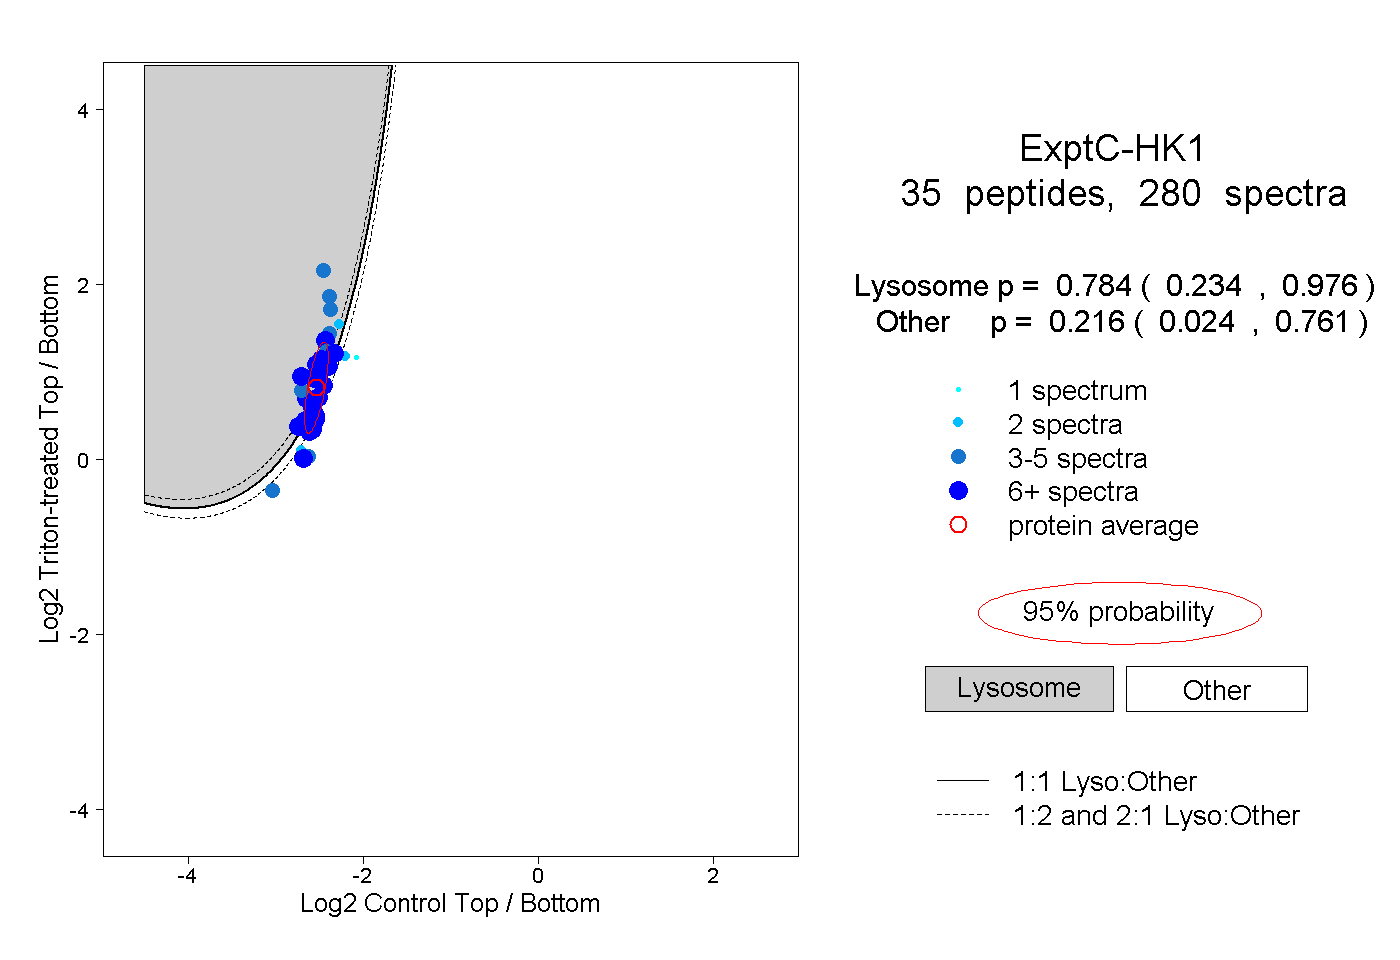
0.234 | 0.976
0.024 | 0.761
8peptides
spectra
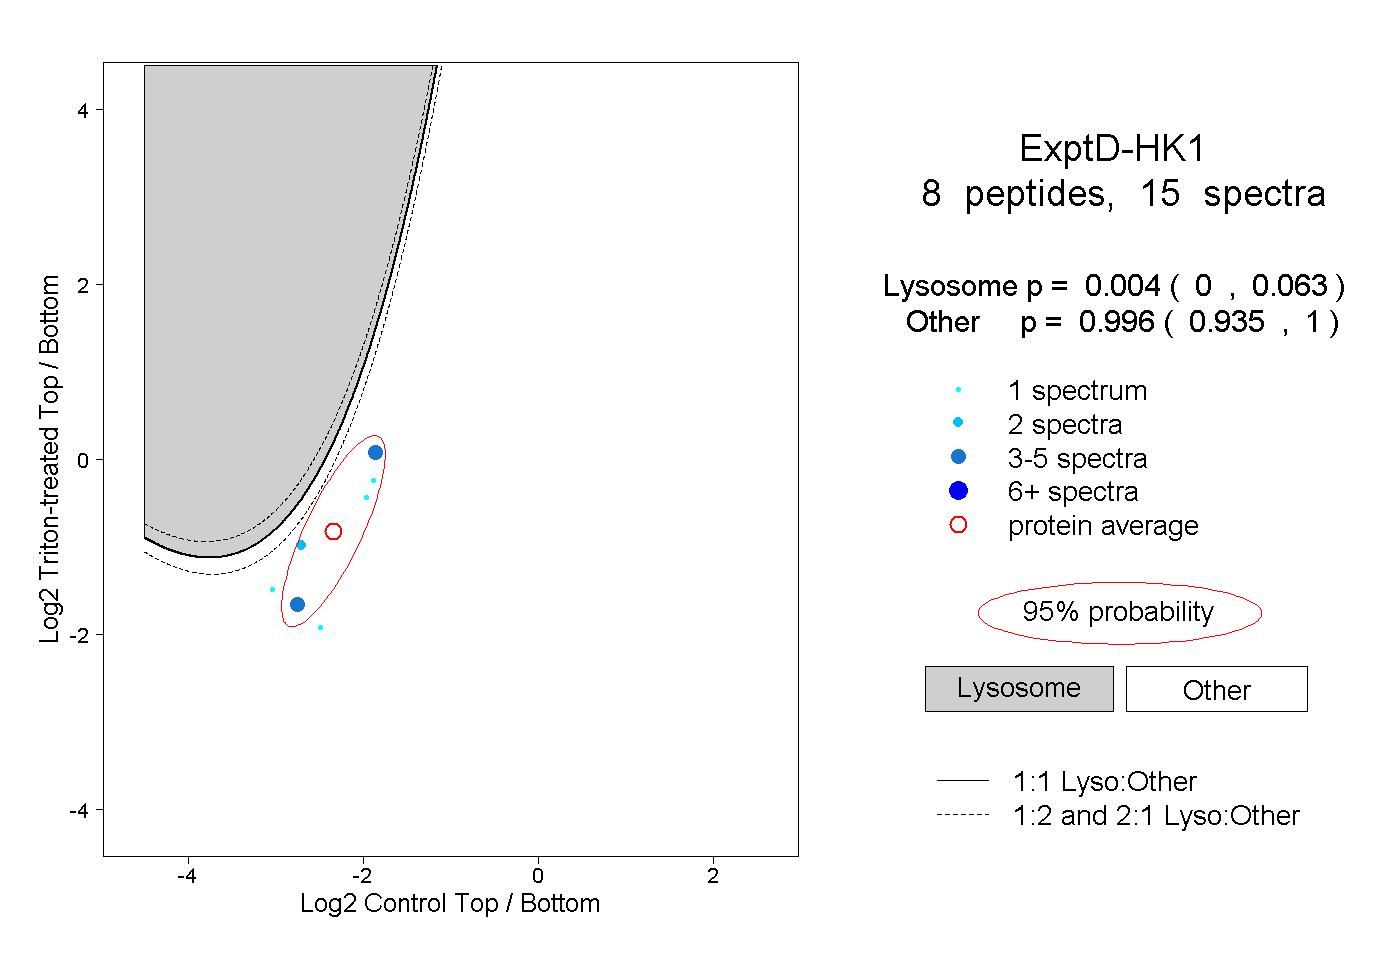
0.000 | 0.063
0.935 | 1.000