 20
20peptides
spectra
0.000 | 0.000
0.193 | 0.206
0.793 | 0.806
0.000 | 0.000
0.000 | 0.000
0.000 | 0.000
0.000 | 0.000
0.000 | 0.000
| Plot | Mito | Lyso | Perox | ER | Golgi | PM | Cytosol | Nucleus | |||||
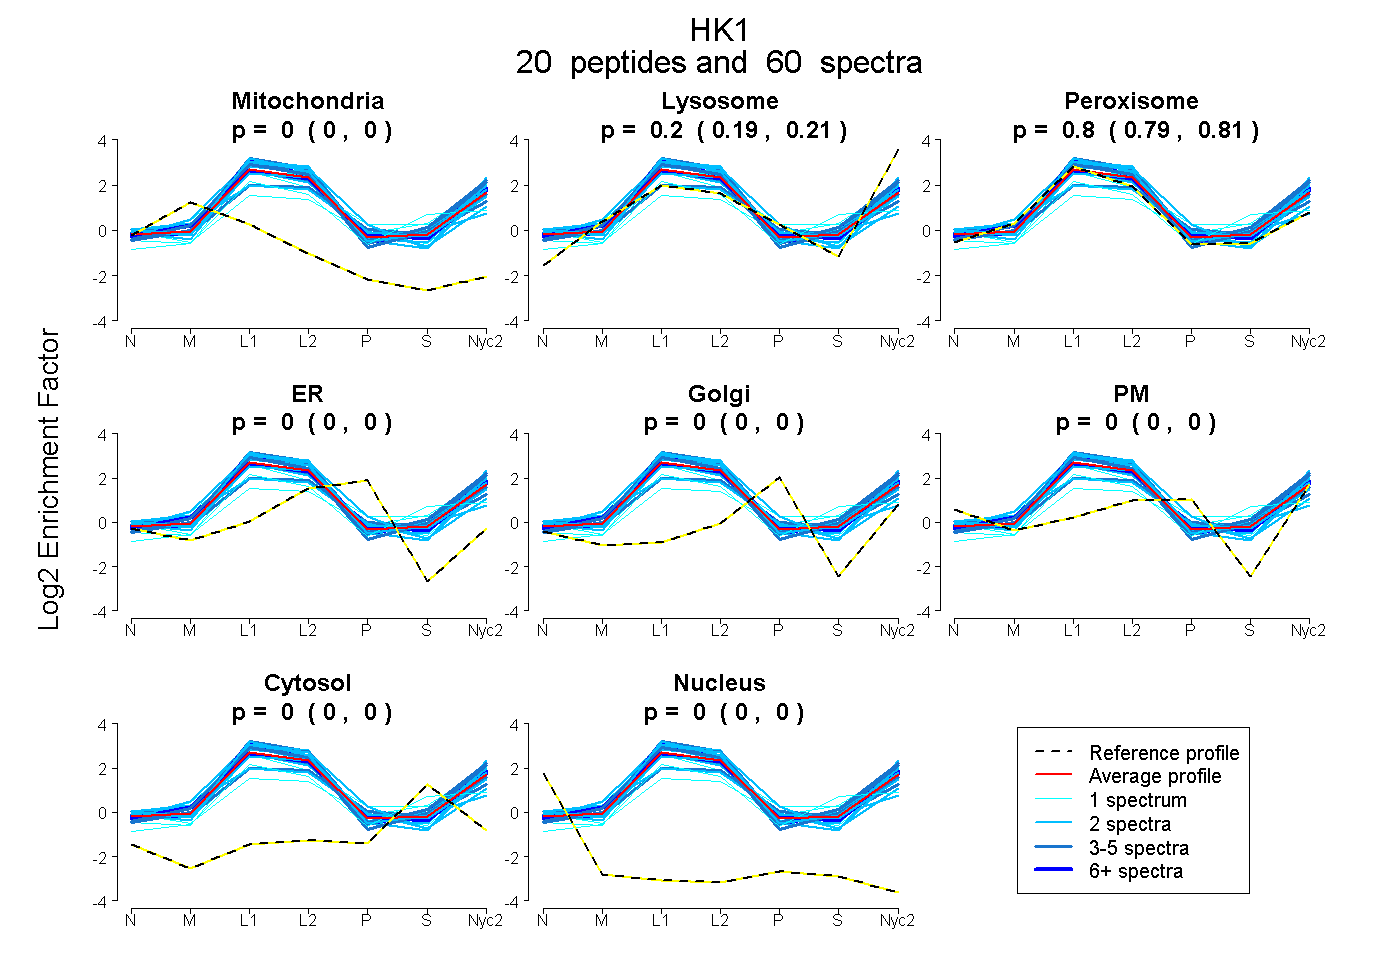
| Expt A |
20 peptides |
60 spectra |
|
0.000 0.000 | 0.000 |
0.200 0.193 | 0.206 |
0.800 0.793 | 0.806 |
0.000 0.000 | 0.000 |
0.000 0.000 | 0.000 |
0.000 0.000 | 0.000 |
0.000 0.000 | 0.000 |
0.000 0.000 | 0.000 |
| 3 spectra, MISGMYLGEIVR | 0.000 | 0.338 | 0.661 | 0.000 | 0.000 | 0.000 | 0.000 | 0.000 | ||
| 1 spectrum, FLLSESGSGK | 0.000 | 0.177 | 0.789 | 0.000 | 0.000 | 0.034 | 0.000 | 0.000 | ||
| 2 spectra, LAEQHR | 0.000 | 0.000 | 0.740 | 0.000 | 0.000 | 0.260 | 0.000 | 0.000 | ||
| 2 spectra, QIEETLAHFR | 0.000 | 0.098 | 0.807 | 0.000 | 0.000 | 0.095 | 0.000 | 0.000 | ||
| 2 spectra, SIPDGTEHGDFLALDLGGTNFR | 0.000 | 0.145 | 0.855 | 0.000 | 0.000 | 0.000 | 0.000 | 0.000 | ||
| 9 spectra, MLPSFVR | 0.000 | 0.252 | 0.748 | 0.000 | 0.000 | 0.000 | 0.000 | 0.000 | ||
| 4 spectra, HIDLVEGDEGR | 0.000 | 0.059 | 0.709 | 0.000 | 0.000 | 0.178 | 0.055 | 0.000 | ||
| 5 spectra, GAALITAVGVR | 0.000 | 0.173 | 0.827 | 0.000 | 0.000 | 0.000 | 0.000 | 0.000 | ||
| 2 spectra, GDFIALDLGGSSFR | 0.000 | 0.291 | 0.709 | 0.000 | 0.000 | 0.000 | 0.000 | 0.000 | ||
| 1 spectrum, GQISEPLK | 0.000 | 0.210 | 0.712 | 0.000 | 0.000 | 0.000 | 0.078 | 0.000 | ||
| 4 spectra, LALLQVR | 0.000 | 0.275 | 0.725 | 0.000 | 0.000 | 0.000 | 0.000 | 0.000 | ||
| 2 spectra, IDEAVLITWTK | 0.000 | 0.202 | 0.798 | 0.000 | 0.000 | 0.000 | 0.000 | 0.000 | ||
| 1 spectrum, AAQLCGAGMAAVVEK | 0.000 | 0.340 | 0.392 | 0.000 | 0.000 | 0.089 | 0.179 | 0.000 | ||
| 9 spectra, GAAMVTAVAYR | 0.000 | 0.183 | 0.817 | 0.000 | 0.000 | 0.000 | 0.000 | 0.000 | ||
| 2 spectra, LSDEILIDILTR | 0.000 | 0.181 | 0.819 | 0.000 | 0.000 | 0.000 | 0.000 | 0.000 | ||
| 2 spectra, LVPDSDVR | 0.000 | 0.265 | 0.721 | 0.014 | 0.000 | 0.000 | 0.000 | 0.000 | ||
| 2 spectra, FLSQIESDR | 0.000 | 0.364 | 0.636 | 0.000 | 0.000 | 0.000 | 0.000 | 0.000 | ||
| 1 spectrum, YLYAMR | 0.000 | 0.059 | 0.741 | 0.000 | 0.000 | 0.000 | 0.200 | 0.000 | ||
| 2 spectra, ATDCEGHDVASLLR | 0.000 | 0.000 | 0.936 | 0.040 | 0.000 | 0.000 | 0.024 | 0.000 | ||
| 4 spectra, MLPTFVR | 0.000 | 0.132 | 0.868 | 0.000 | 0.000 | 0.000 | 0.000 | 0.000 |
| Plot | Mito | Lyso or Perox | ER | Golgi | PM | Cytosol | Nucleus | ||||||
| Expt B |
6 peptides |
9 spectra |
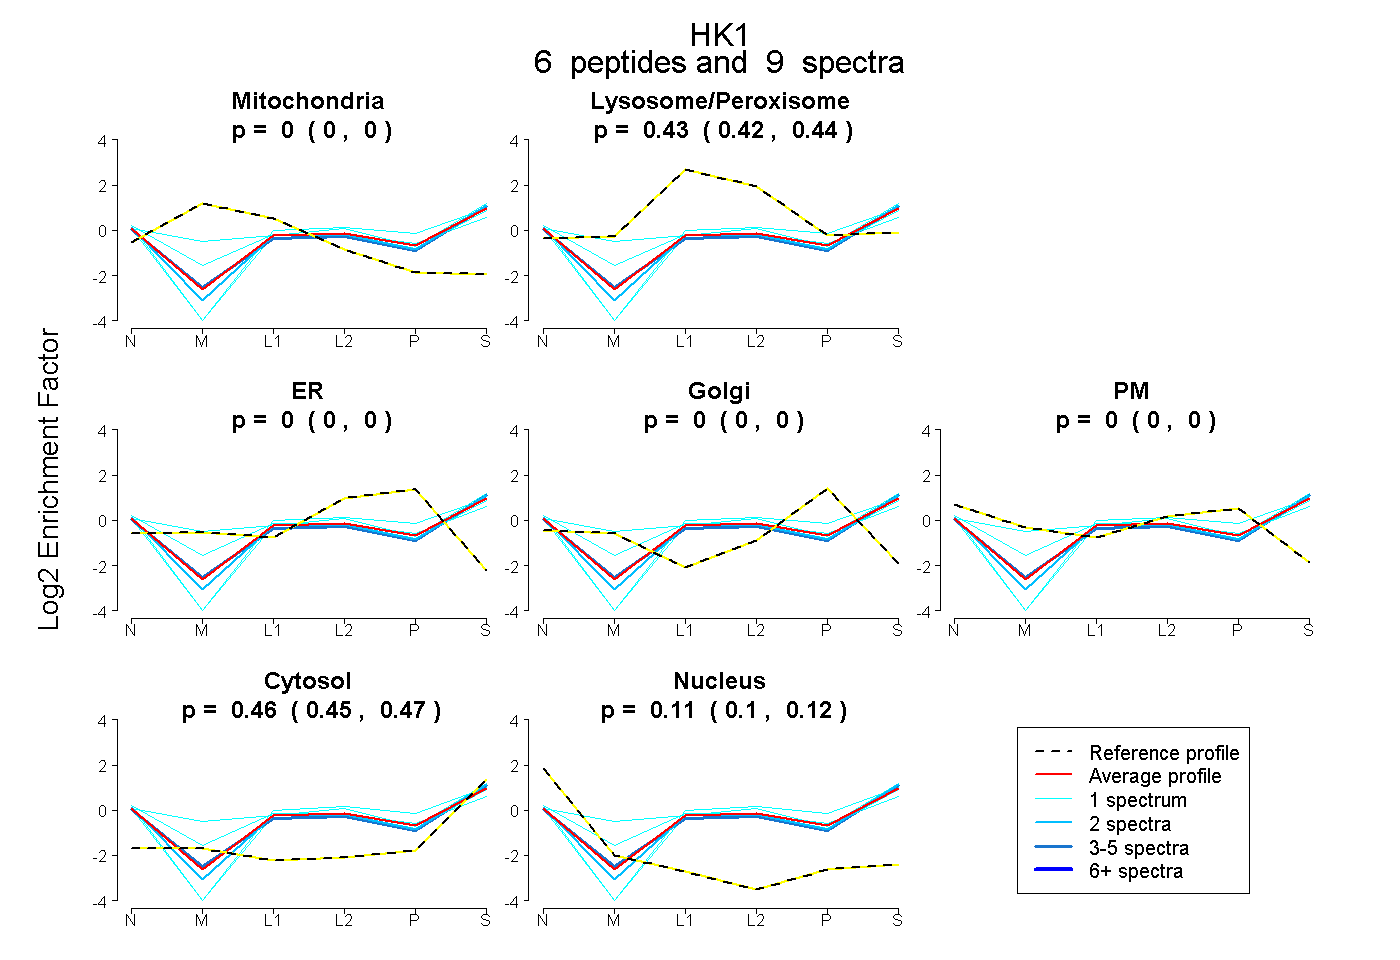 |
0.000 0.000 | 0.000 |
0.430 0.419 | 0.438 |
0.000 0.000 | 0.000 |
0.000 0.000 | 0.000 |
0.000 0.000 | 0.000 |
0.461 0.450 | 0.470 |
0.109 0.100 | 0.116 |
|||
| Plot | Lyso | Other | |||||||||||
| Expt C |
35 peptides |
280 spectra |
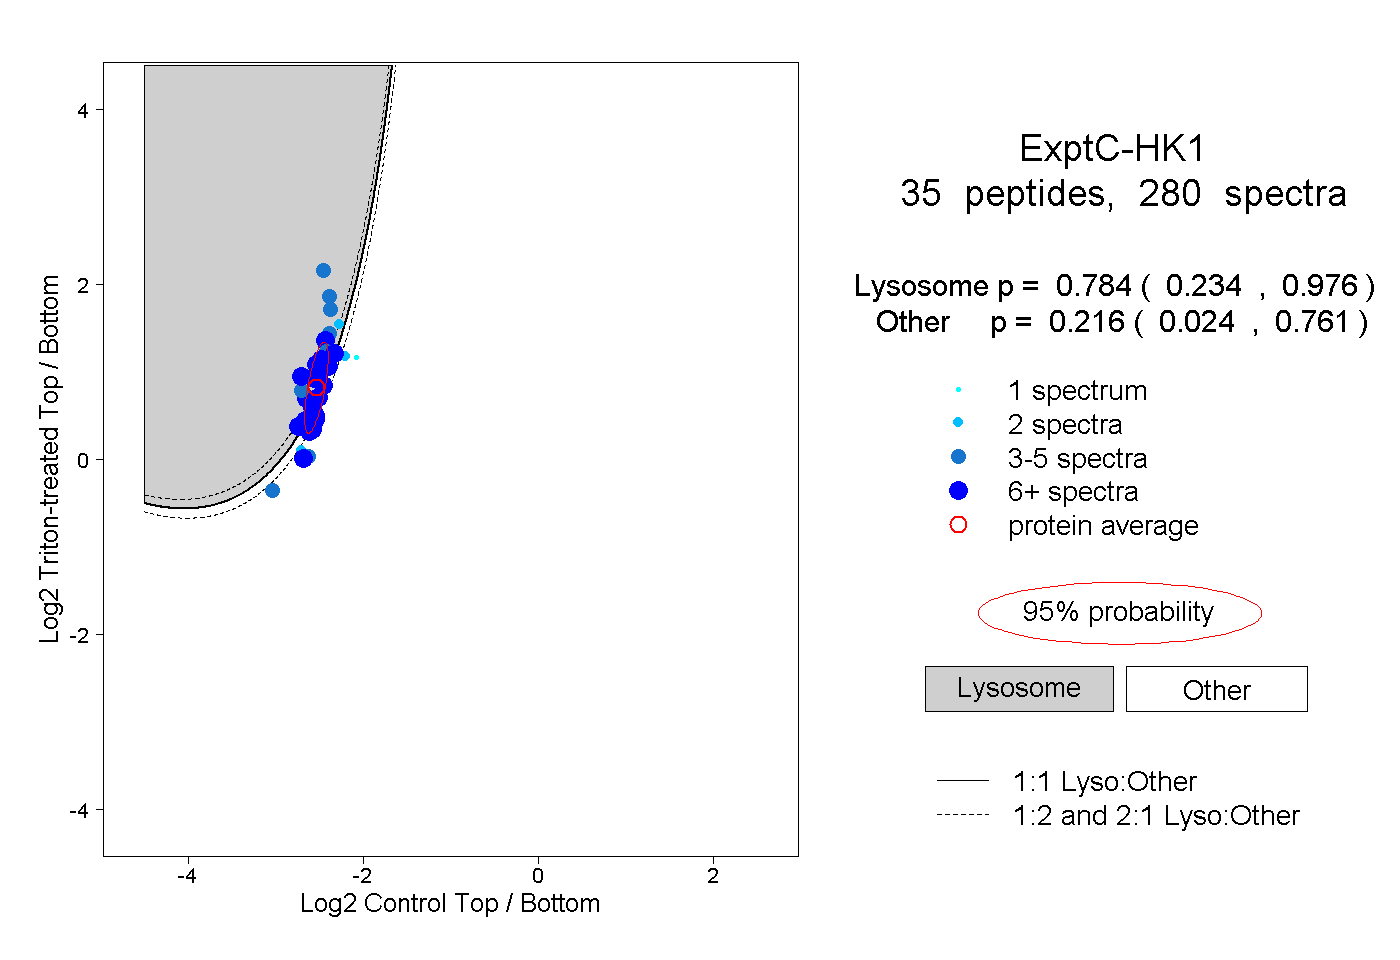 |
0.784 0.234 | 0.976 |
0.216 0.024 | 0.761 |
||||||||
| Plot | Lyso | Other | |||||||||||
| Expt D |
8 peptides |
15 spectra |
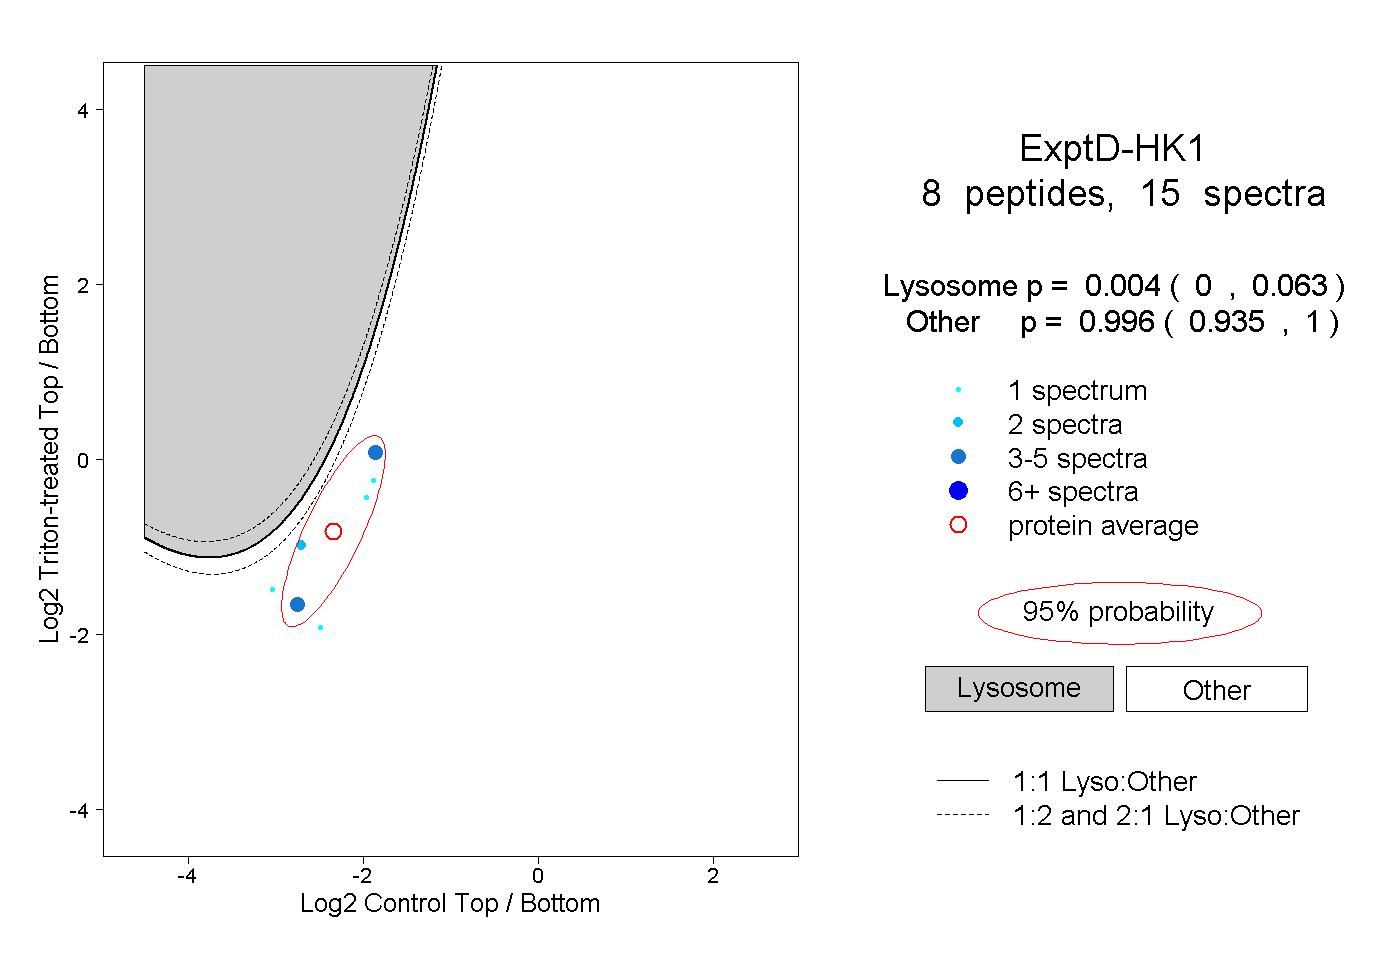 |
0.004 0.000 | 0.063 |
0.996 0.935 | 1.000 |