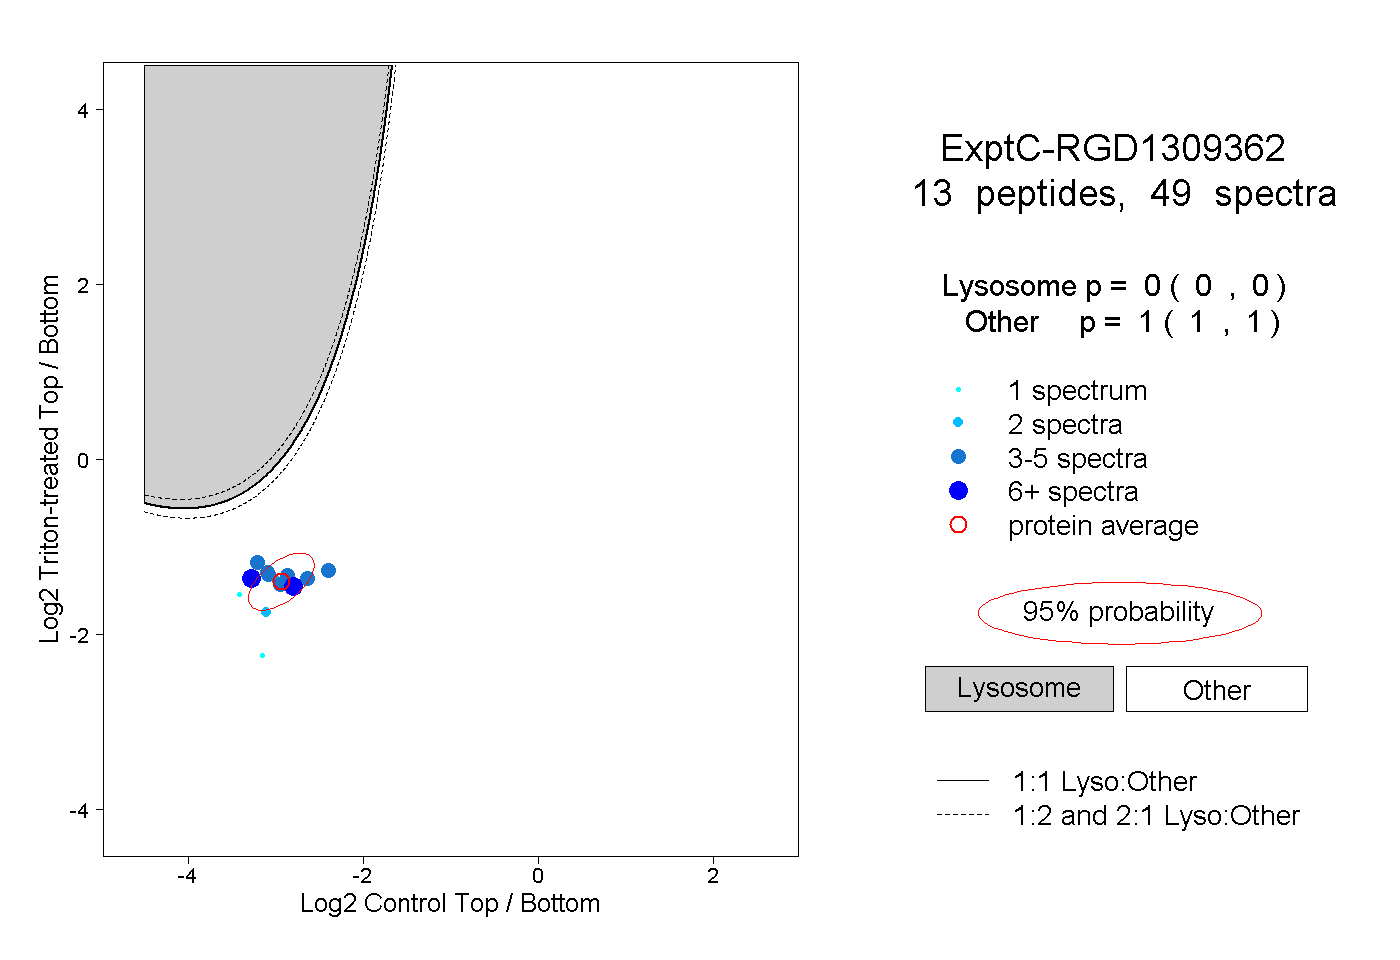
19
19peptides
spectra
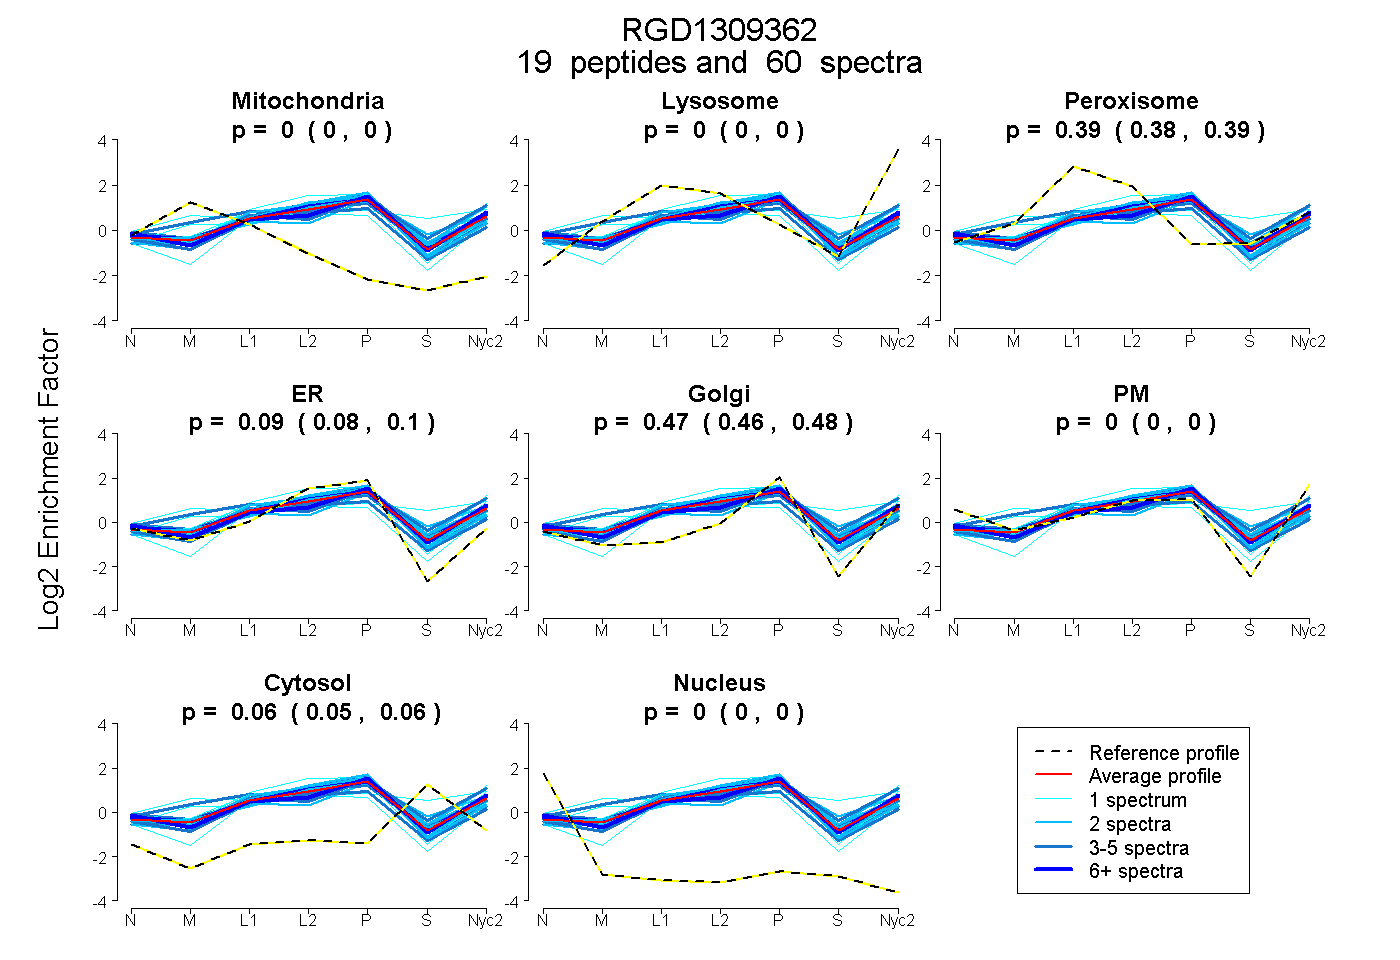
0.000 | 0.000
0.000 | 0.000
0.384 | 0.392
0.078 | 0.096
0.458 | 0.476
0.000 | 0.000
0.052 | 0.059
0.000 | 0.000
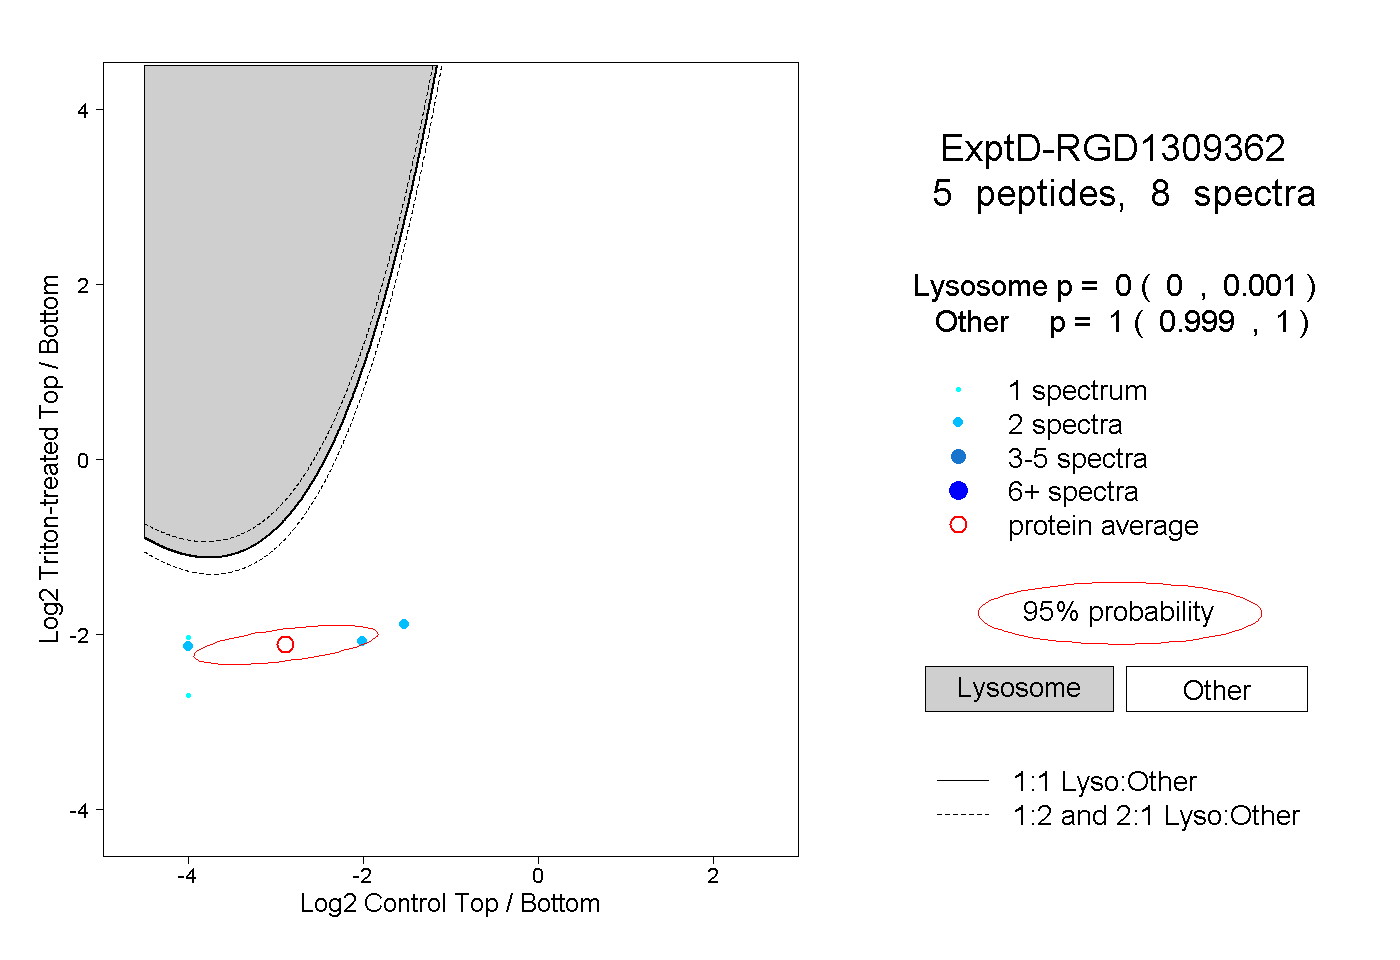
10peptides
spectra
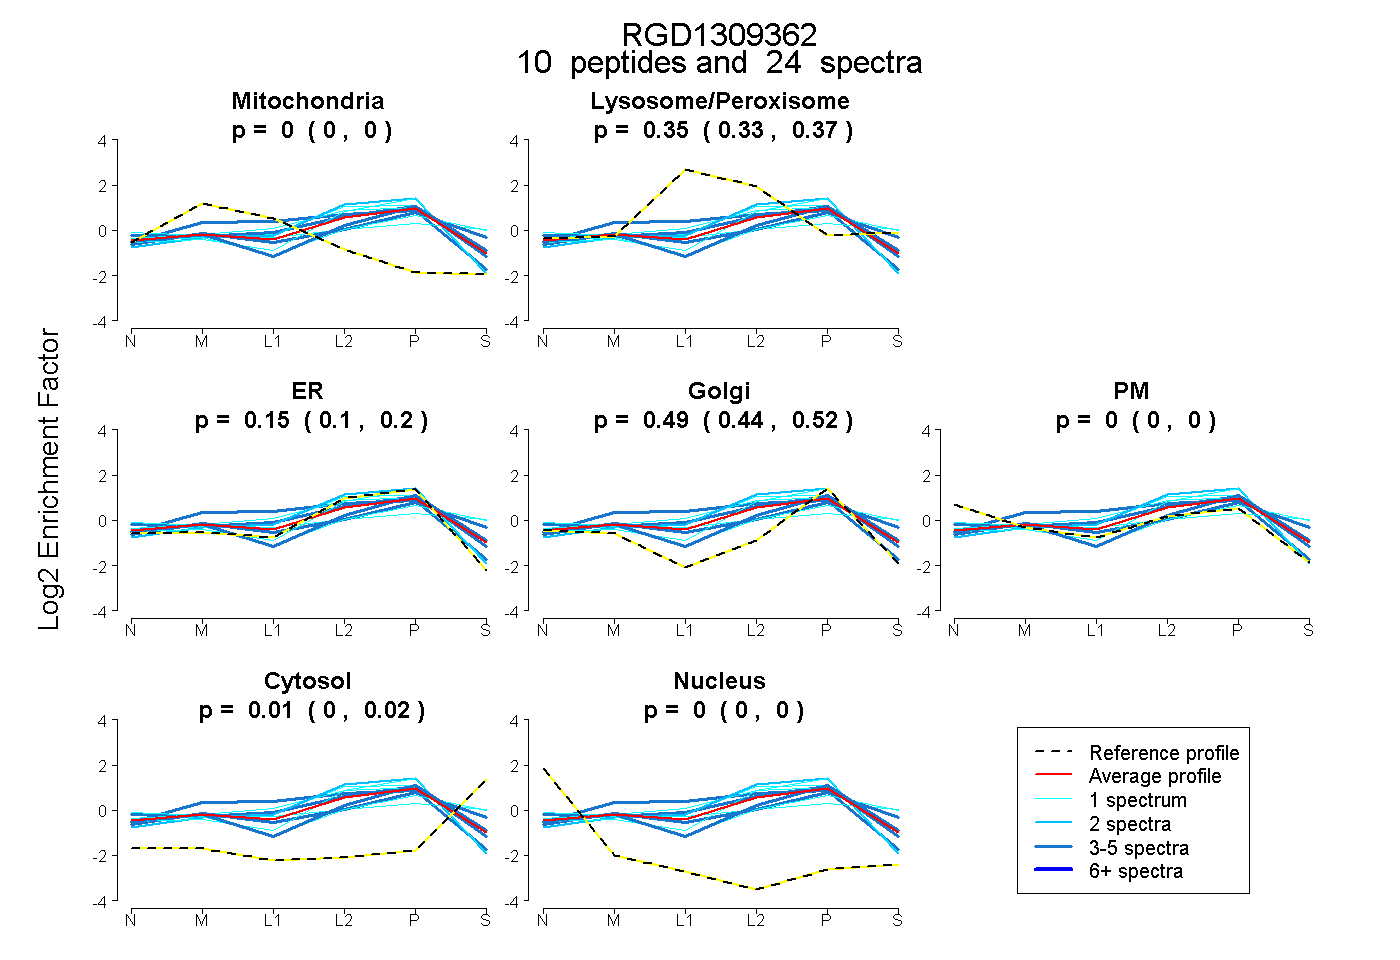
0.000 | 0.000
0.326 | 0.367
0.104 | 0.201
0.444 | 0.520
0.000 | 0.000
0.000 | 0.019
0.000 | 0.000