 19
19peptides
spectra
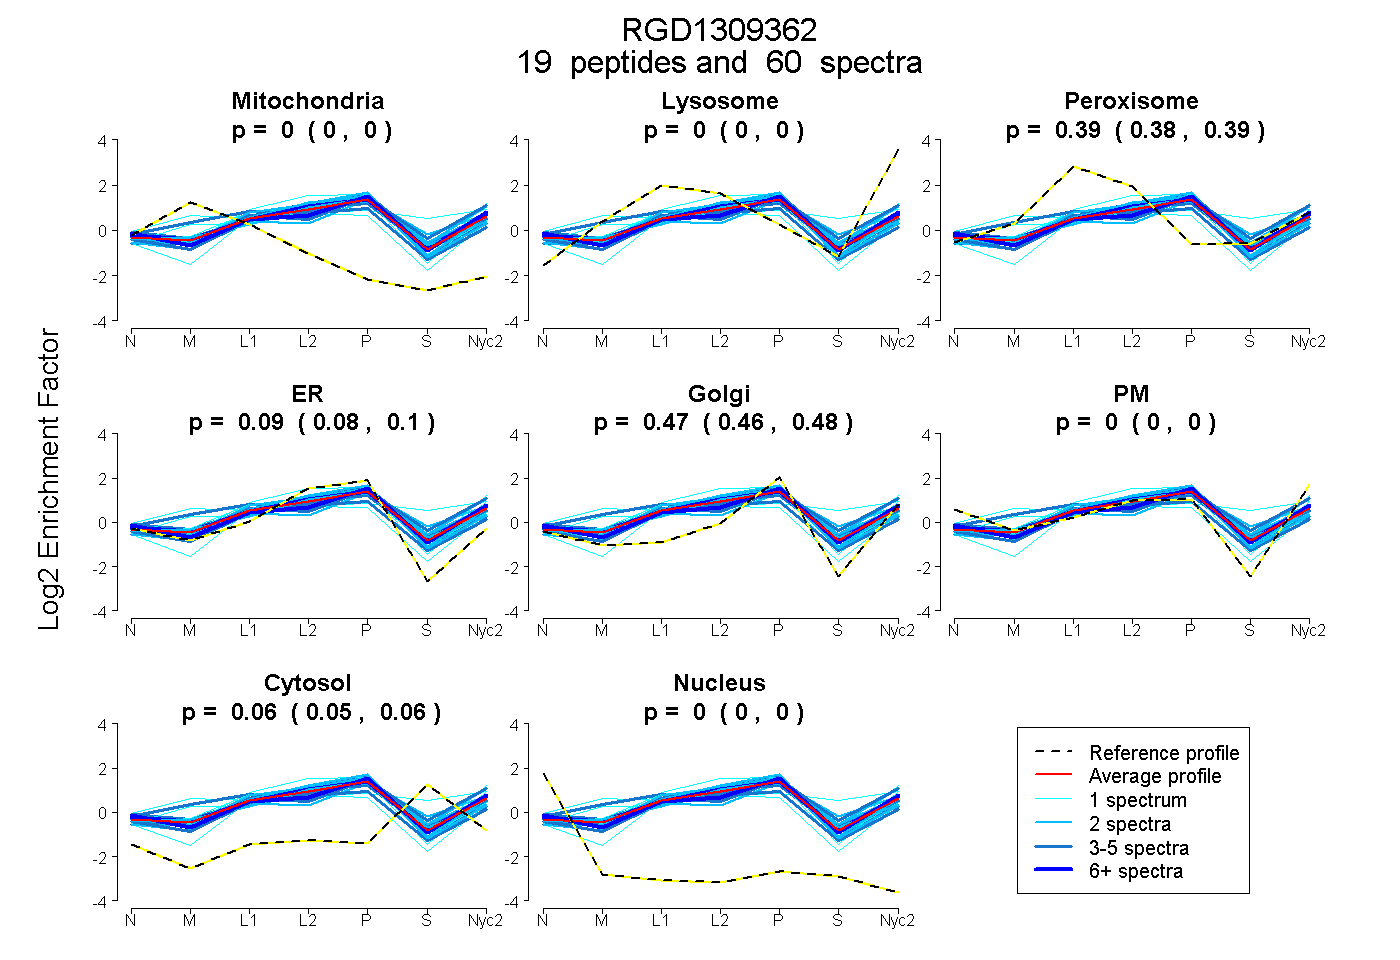
0.000 | 0.000
0.000 | 0.000
0.384 | 0.392
0.078 | 0.096
0.458 | 0.476
0.000 | 0.000
0.052 | 0.059
0.000 | 0.000
| Plot | Mito | Lyso | Perox | ER | Golgi | PM | Cytosol | Nucleus | |||||
| Expt A |
19 peptides |
60 spectra |
|
0.000 0.000 | 0.000 |
0.000 0.000 | 0.000 |
0.389 0.384 | 0.392 |
0.088 0.078 | 0.096 |
0.468 0.458 | 0.476 |
0.000 0.000 | 0.000 |
0.056 0.052 | 0.059 |
0.000 0.000 | 0.000 |
| 3 spectra, EIFYLK | 0.000 | 0.000 | 0.380 | 0.000 | 0.530 | 0.000 | 0.090 | 0.000 | ||
| 5 spectra, GIGHEEEGAAK | 0.000 | 0.000 | 0.365 | 0.248 | 0.289 | 0.000 | 0.098 | 0.000 | ||
| 1 spectrum, LISDLPVYK | 0.000 | 0.000 | 0.388 | 0.216 | 0.385 | 0.000 | 0.011 | 0.000 | ||
| 1 spectrum, EIDGTPLNVAVTGESGAGK | 0.000 | 0.271 | 0.121 | 0.199 | 0.031 | 0.000 | 0.378 | 0.000 | ||
| 2 spectra, IISEEIITSVELSMTK | 0.000 | 0.152 | 0.189 | 0.206 | 0.128 | 0.191 | 0.133 | 0.000 | ||
| 11 spectra, SSFINALR | 0.000 | 0.013 | 0.384 | 0.098 | 0.459 | 0.000 | 0.046 | 0.000 | ||
| 3 spectra, SPIVFKPTDEETIHER | 0.000 | 0.199 | 0.181 | 0.125 | 0.343 | 0.000 | 0.152 | 0.000 | ||
| 2 spectra, NLSDYDFPILMDK | 0.000 | 0.134 | 0.257 | 0.293 | 0.203 | 0.000 | 0.113 | 0.000 | ||
| 1 spectrum, IDSDLR | 0.021 | 0.194 | 0.184 | 0.242 | 0.358 | 0.000 | 0.000 | 0.000 | ||
| 1 spectrum, GNIQMANSAISEALR | 0.000 | 0.199 | 0.201 | 0.337 | 0.139 | 0.117 | 0.007 | 0.000 | ||
| 2 spectra, TVFGVDDAALQSLAK | 0.000 | 0.023 | 0.298 | 0.250 | 0.313 | 0.000 | 0.116 | 0.000 | ||
| 4 spectra, DWQMPLVELEAK | 0.000 | 0.021 | 0.321 | 0.280 | 0.358 | 0.000 | 0.018 | 0.000 | ||
| 2 spectra, NDIDLAK | 0.000 | 0.081 | 0.240 | 0.345 | 0.290 | 0.000 | 0.044 | 0.000 | ||
| 9 spectra, VIQNLR | 0.000 | 0.000 | 0.357 | 0.000 | 0.594 | 0.000 | 0.050 | 0.000 | ||
| 2 spectra, FYFLDIVTEDSK | 0.000 | 0.078 | 0.270 | 0.000 | 0.448 | 0.000 | 0.204 | 0.000 | ||
| 3 spectra, AISMMK | 0.000 | 0.110 | 0.219 | 0.171 | 0.377 | 0.000 | 0.123 | 0.000 | ||
| 1 spectrum, DFYFVR | 0.205 | 0.053 | 0.200 | 0.159 | 0.140 | 0.243 | 0.000 | 0.000 | ||
| 2 spectra, NEEEFKPR | 0.000 | 0.000 | 0.310 | 0.331 | 0.313 | 0.000 | 0.046 | 0.000 | ||
| 5 spectra, IGVVETTAER | 0.110 | 0.000 | 0.398 | 0.151 | 0.342 | 0.000 | 0.000 | 0.000 |
| Plot | Mito | Lyso or Perox | ER | Golgi | PM | Cytosol | Nucleus | ||||||
| Expt B |
10 peptides |
24 spectra |
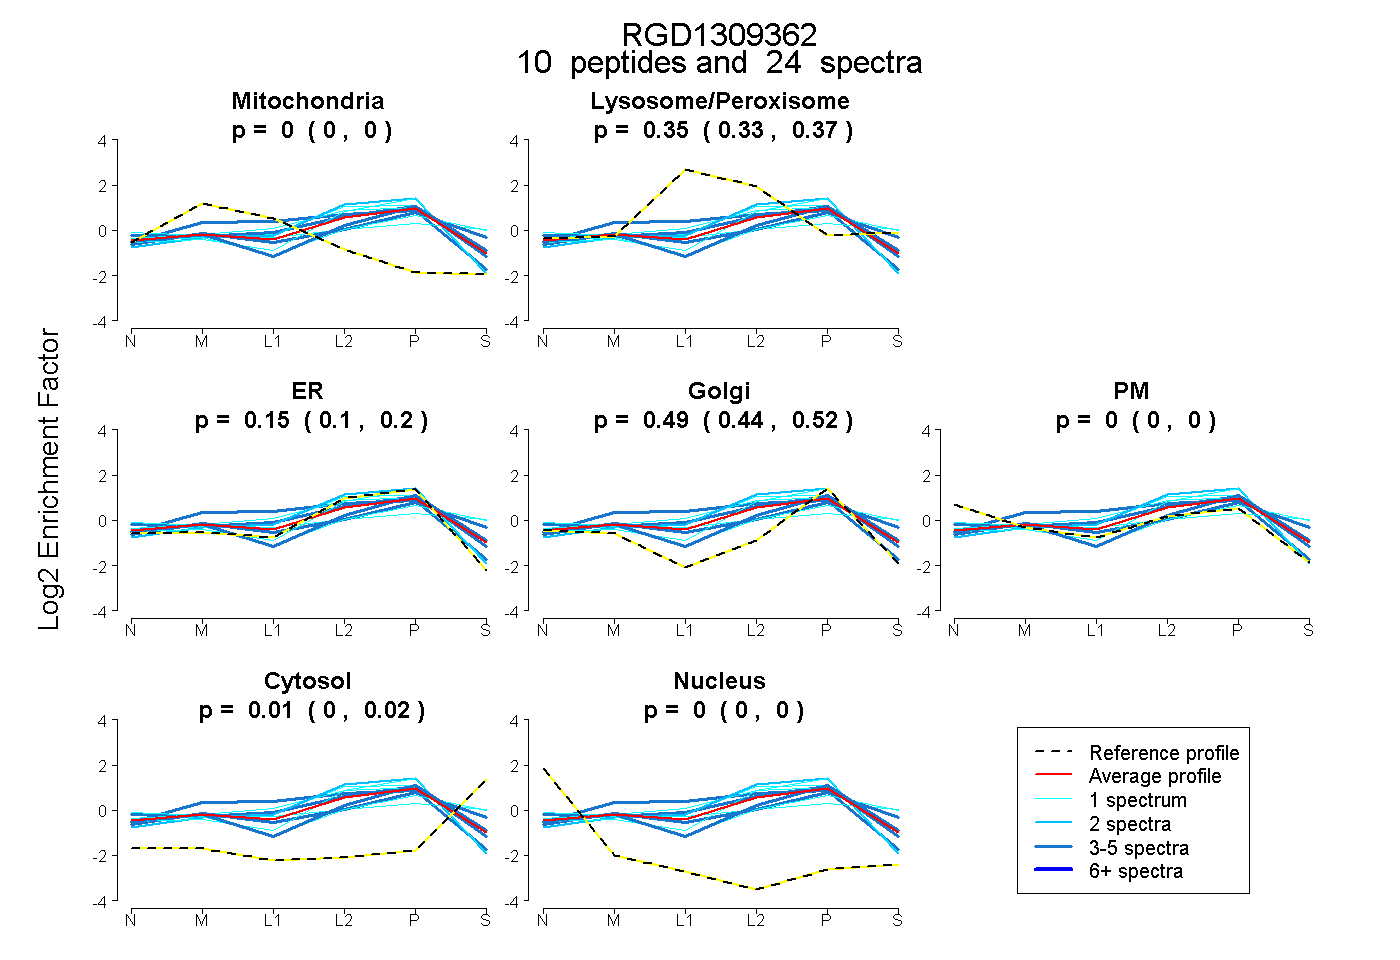 |
0.000 0.000 | 0.000 |
0.349 0.326 | 0.367 |
0.154 0.104 | 0.201 |
0.491 0.444 | 0.520 |
0.000 0.000 | 0.000 |
0.006 0.000 | 0.019 |
0.000 0.000 | 0.000 |
|||
| Plot | Lyso | Other | |||||||||||
| Expt C |
13 peptides |
49 spectra |
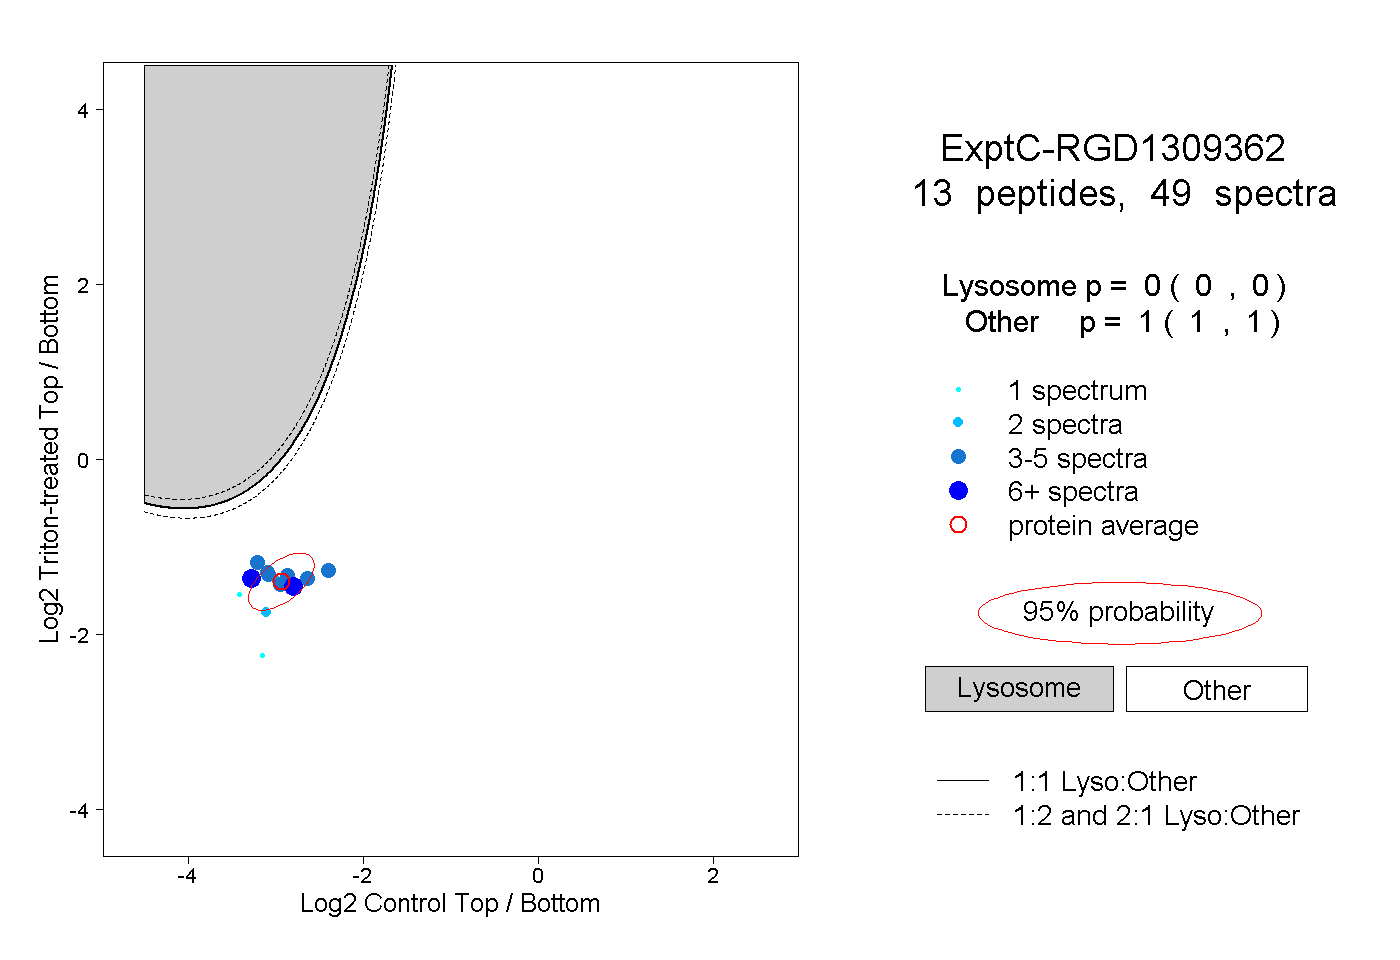 |
0.000 0.000 | 0.000 |
1.000 1.000 | 1.000 |
||||||||
| Plot | Lyso | Other | |||||||||||
| Expt D |
5 peptides |
8 spectra |
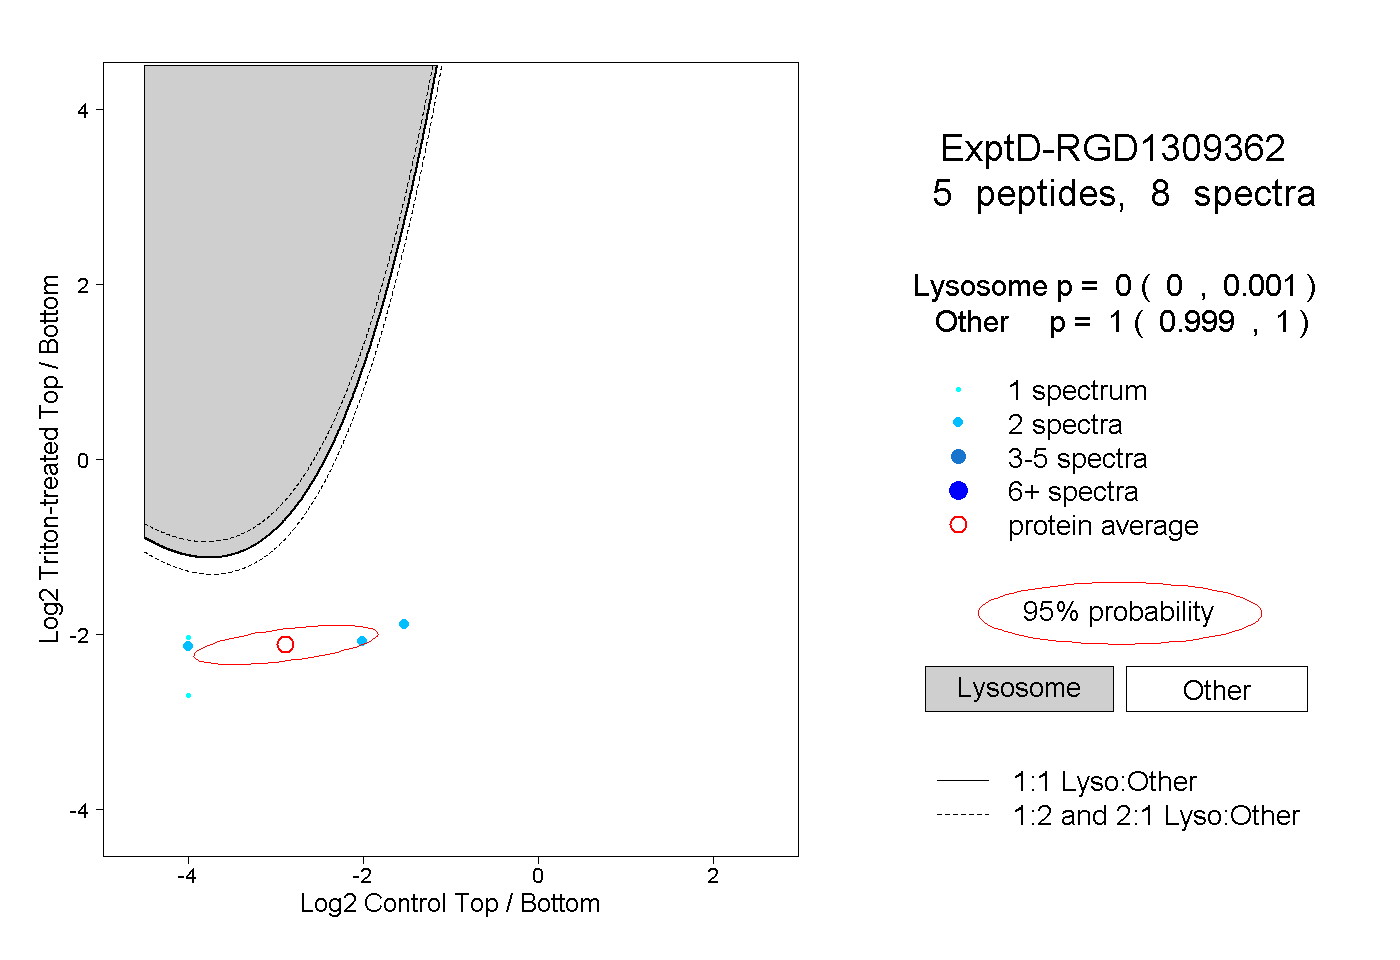 |
0.000 0.000 | 0.001 |
1.000 0.999 | 1.000 |