 5
5peptides
spectra
0.000 | 0.060
0.000 | 0.031
0.000 | 0.024
0.000 | 0.000
0.000 | 0.045
0.070 | 0.159
0.799 | 0.846
0.000 | 0.000
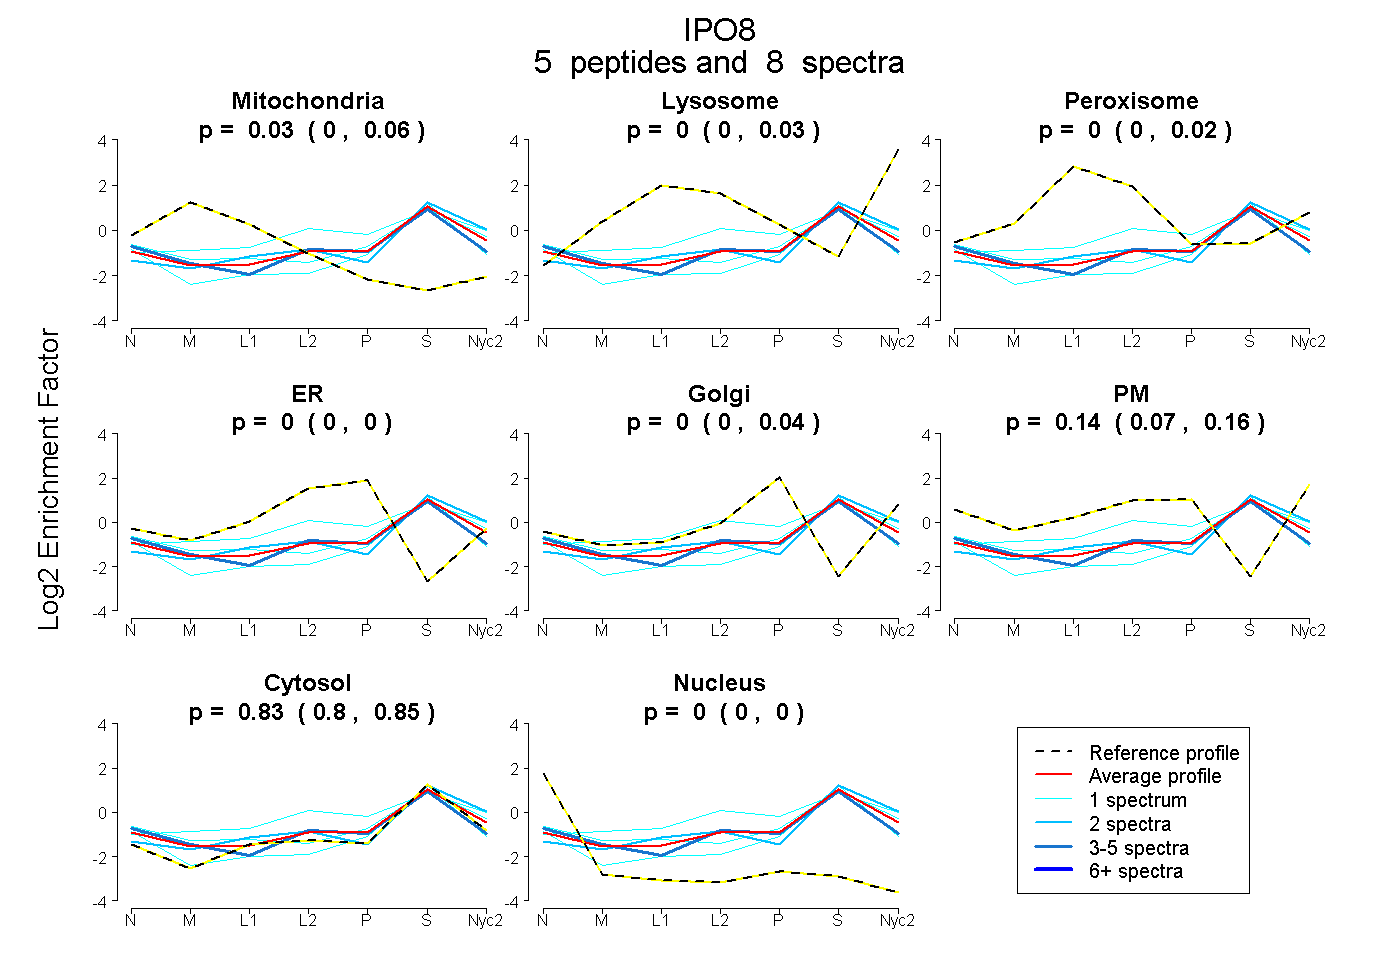
| Plot | Mito | Lyso | Perox | ER | Golgi | PM | Cytosol | Nucleus | |||||
| Expt A |
5 peptides |
8 spectra |
|
0.031 0.000 | 0.060 |
0.000 0.000 | 0.031 |
0.000 0.000 | 0.024 |
0.000 0.000 | 0.000 |
0.000 0.000 | 0.045 |
0.142 0.070 | 0.159 |
0.828 0.799 | 0.846 |
0.000 0.000 | 0.000 |
| 1 spectrum, DNIVEGIIR | 0.000 | 0.000 | 0.000 | 0.000 | 0.002 | 0.000 | 0.896 | 0.102 | ||
| 1 spectrum, HLEVLFTMCR | 0.000 | 0.134 | 0.114 | 0.117 | 0.030 | 0.000 | 0.606 | 0.000 | ||
| 3 spectra, WALHIVTR | 0.071 | 0.000 | 0.000 | 0.024 | 0.048 | 0.036 | 0.797 | 0.024 | ||
| 2 spectra, ILDQYR | 0.000 | 0.151 | 0.000 | 0.000 | 0.000 | 0.000 | 0.849 | 0.000 | ||
| 1 spectrum, IDYYLK | 0.057 | 0.000 | 0.000 | 0.000 | 0.000 | 0.166 | 0.777 | 0.000 |
| Plot | Lyso | Other | |||||||||||
| Expt C |
1 peptide |
3 spectra |
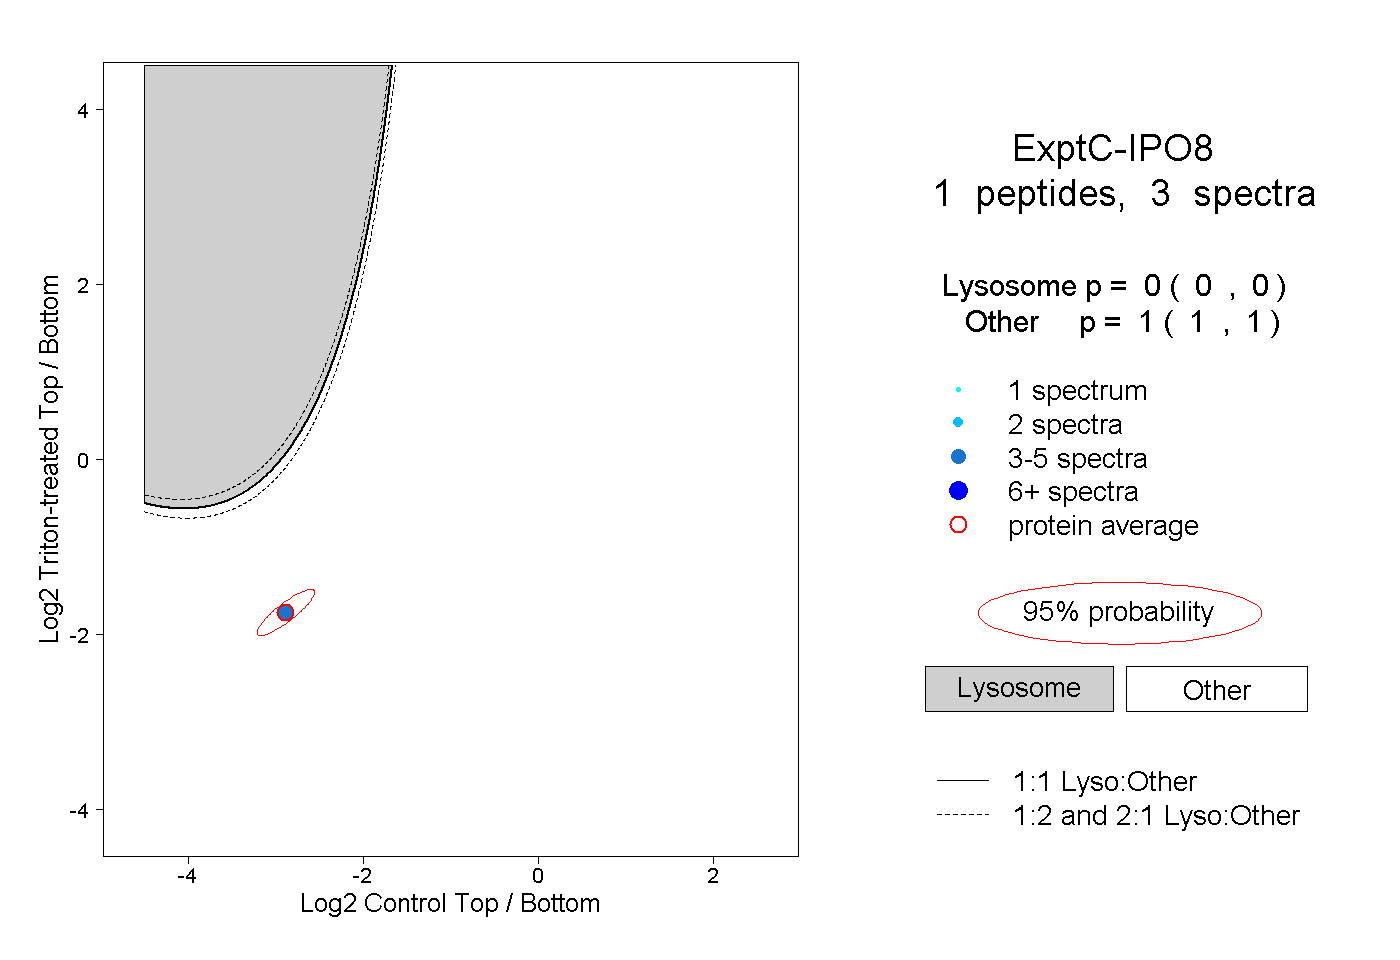 |
0.000 0.000 | 0.000 |
1.000 1.000 | 1.000 |