11
11peptides
spectra
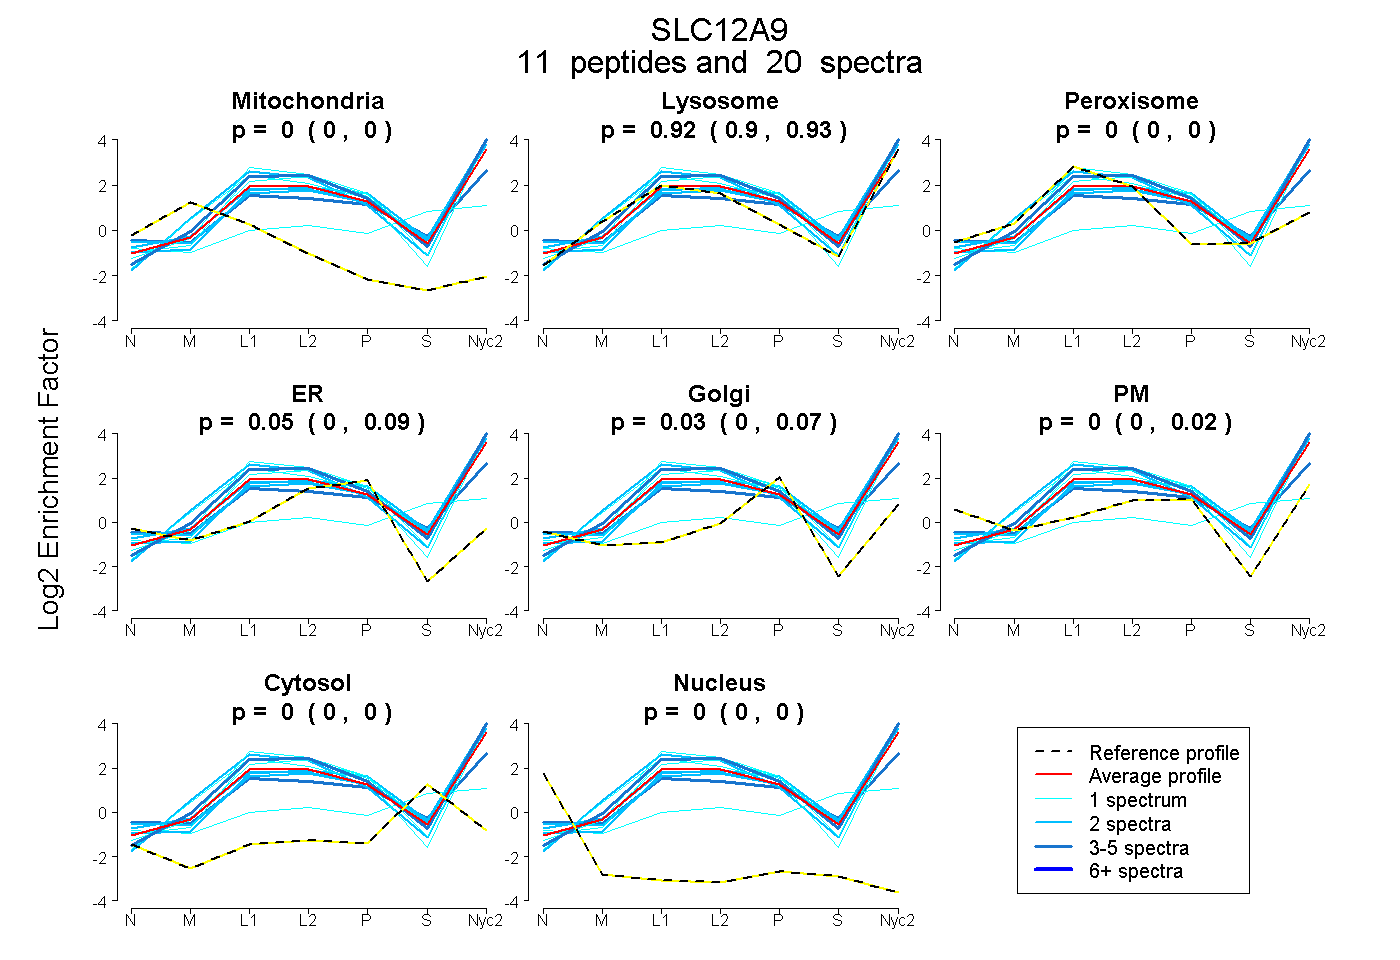
0.000 | 0.000
0.895 | 0.931
0.000 | 0.000
0.003 | 0.087
0.000 | 0.067
0.000 | 0.023
0.000 | 0.000
0.000 | 0.000
3peptides
spectra
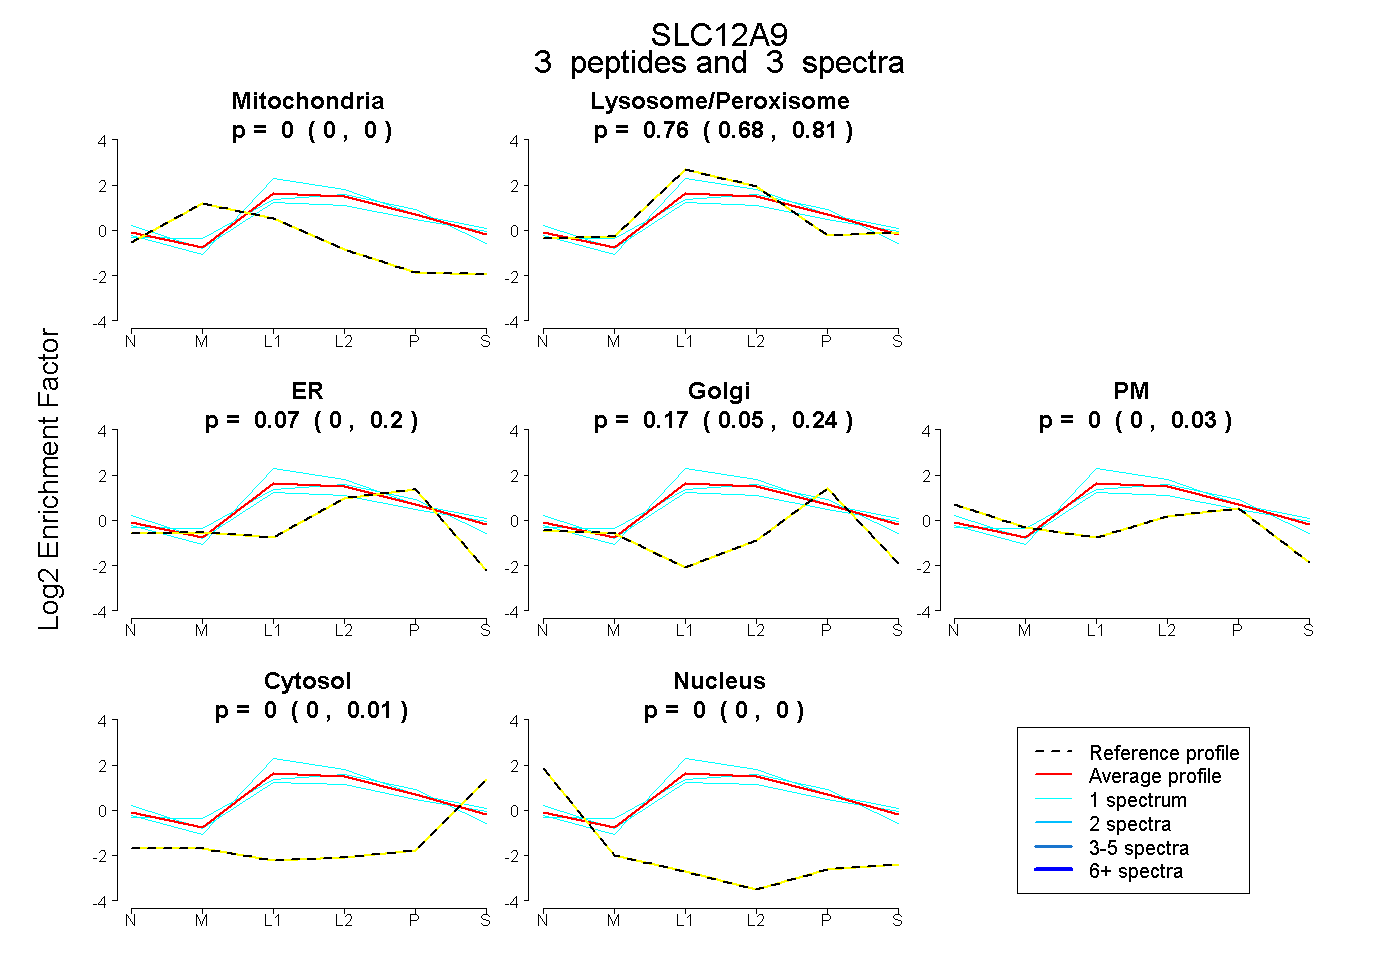
0.000 | 0.000
0.676 | 0.813
0.000 | 0.199
0.053 | 0.238
0.000 | 0.033
0.000 | 0.014
0.000 | 0.000
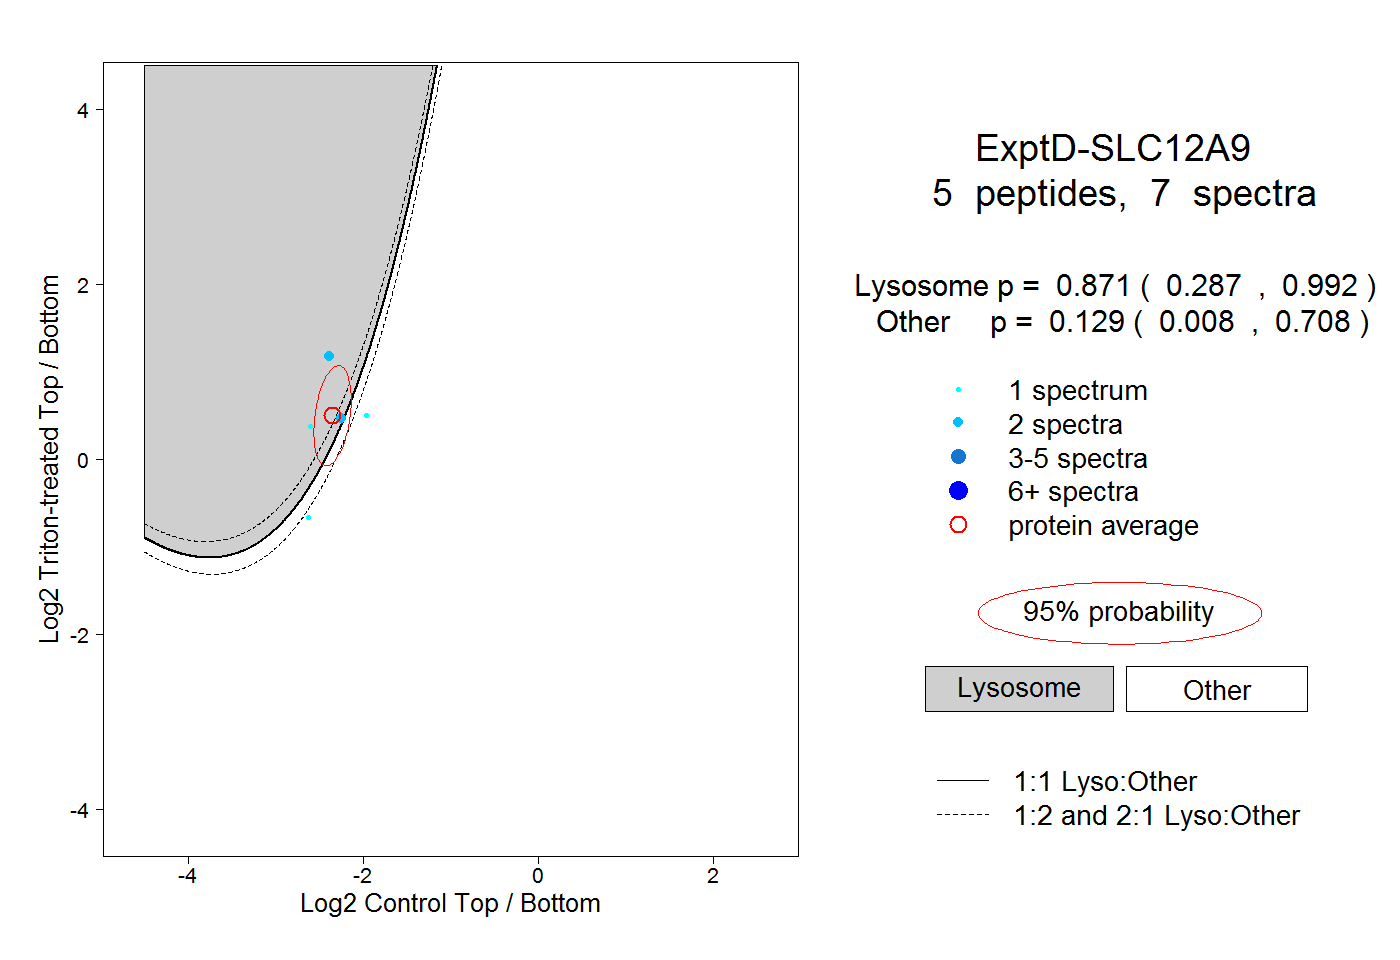
9peptides
spectra
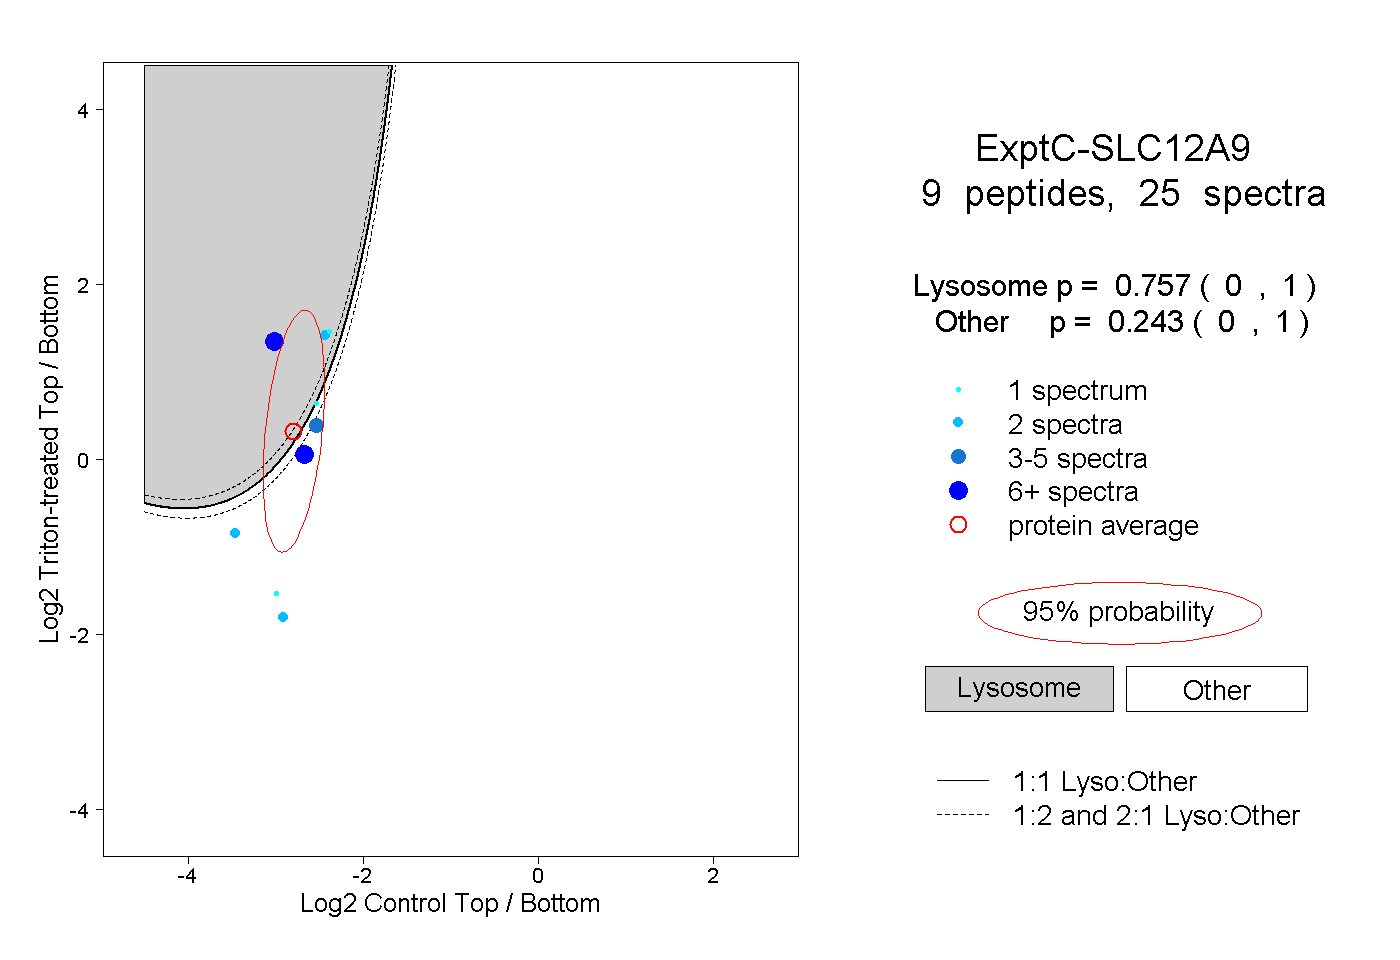
0.000 | 1.000
0.000 | 1.000