 11
11peptides
spectra
0.000 | 0.000
0.895 | 0.931
0.000 | 0.000
0.003 | 0.087
0.000 | 0.067
0.000 | 0.023
0.000 | 0.000
0.000 | 0.000
| Plot | Mito | Lyso | Perox | ER | Golgi | PM | Cytosol | Nucleus | |||||
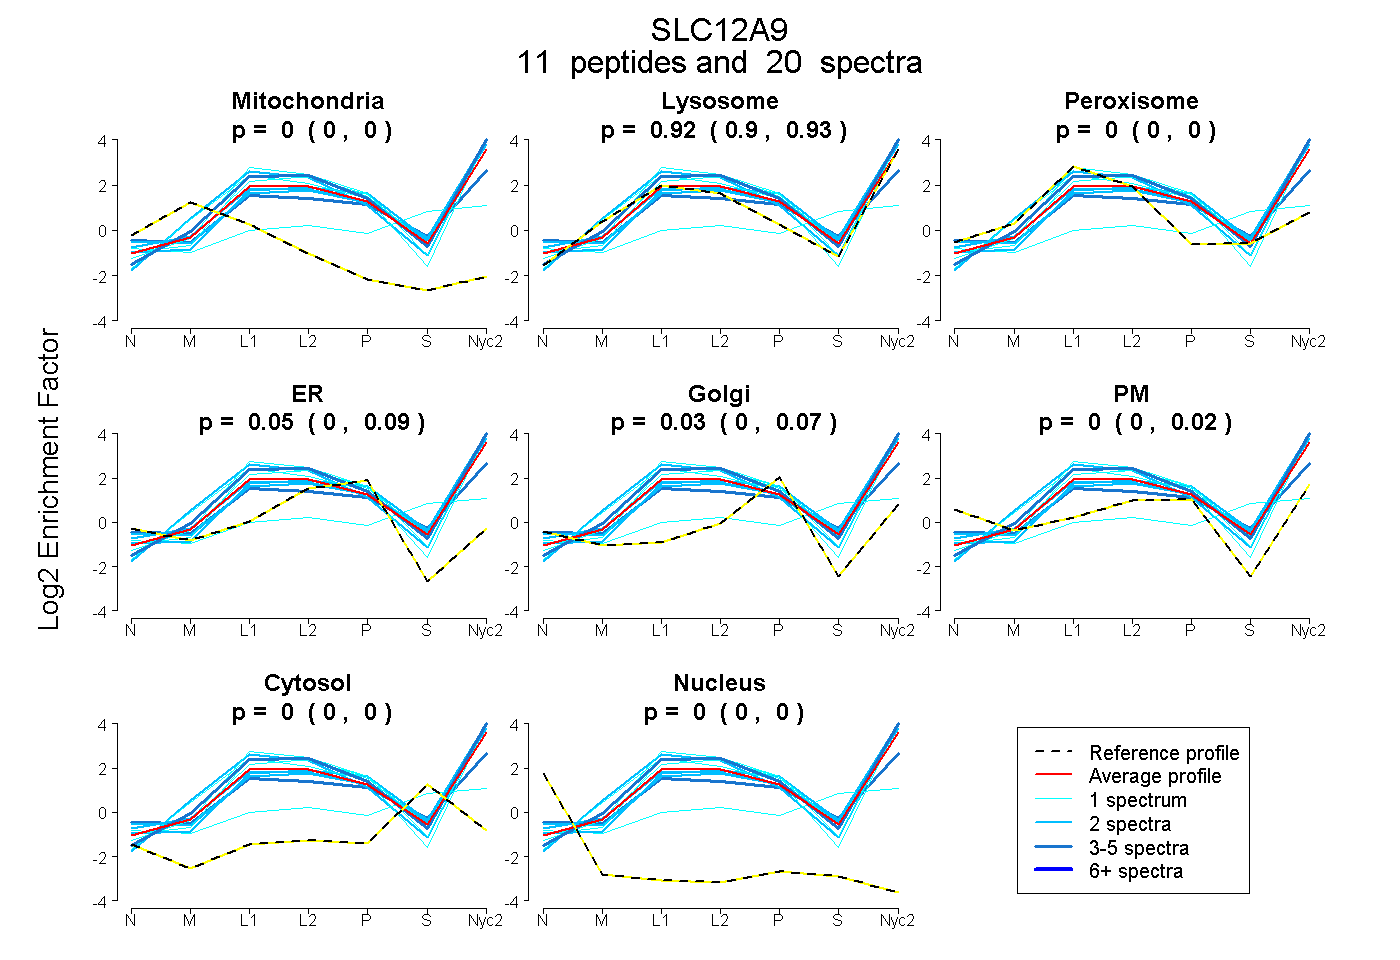
| Expt A |
11 peptides |
20 spectra |
|
0.000 0.000 | 0.000 |
0.917 0.895 | 0.931 |
0.000 0.000 | 0.000 |
0.050 0.003 | 0.087 |
0.033 0.000 | 0.067 |
0.000 0.000 | 0.023 |
0.000 0.000 | 0.000 |
0.000 0.000 | 0.000 |
| 2 spectra, ALLQGDYGFFR | 0.000 | 1.000 | 0.000 | 0.000 | 0.000 | 0.000 | 0.000 | 0.000 | ||
| 3 spectra, YLALLETLSR | 0.000 | 1.000 | 0.000 | 0.000 | 0.000 | 0.000 | 0.000 | 0.000 | ||
| 2 spectra, APGSPR | 0.000 | 0.873 | 0.000 | 0.000 | 0.127 | 0.000 | 0.000 | 0.000 | ||
| 1 spectrum, EAPGAAEGR | 0.000 | 0.973 | 0.000 | 0.027 | 0.000 | 0.000 | 0.000 | 0.000 | ||
| 1 spectrum, ALSPQDYVATVADALK | 0.000 | 0.338 | 0.069 | 0.000 | 0.000 | 0.073 | 0.521 | 0.000 | ||
| 1 spectrum, GGGAYFMISR | 0.000 | 1.000 | 0.000 | 0.000 | 0.000 | 0.000 | 0.000 | 0.000 | ||
| 2 spectra, GTGGGPGGPEGR | 0.000 | 0.901 | 0.000 | 0.000 | 0.000 | 0.099 | 0.000 | 0.000 | ||
| 1 spectrum, NVVLAR | 0.000 | 0.989 | 0.000 | 0.011 | 0.000 | 0.000 | 0.000 | 0.000 | ||
| 1 spectrum, GDEEAEALACSANALVR | 0.000 | 0.983 | 0.000 | 0.017 | 0.000 | 0.000 | 0.000 | 0.000 | ||
| 2 spectra, ALLSQLR | 0.000 | 0.836 | 0.000 | 0.000 | 0.000 | 0.164 | 0.000 | 0.000 | ||
| 4 spectra, ACGALPPER | 0.000 | 0.583 | 0.101 | 0.000 | 0.055 | 0.180 | 0.081 | 0.000 |
| Plot | Mito | Lyso or Perox | ER | Golgi | PM | Cytosol | Nucleus | ||||||
| Expt B |
3 peptides |
3 spectra |
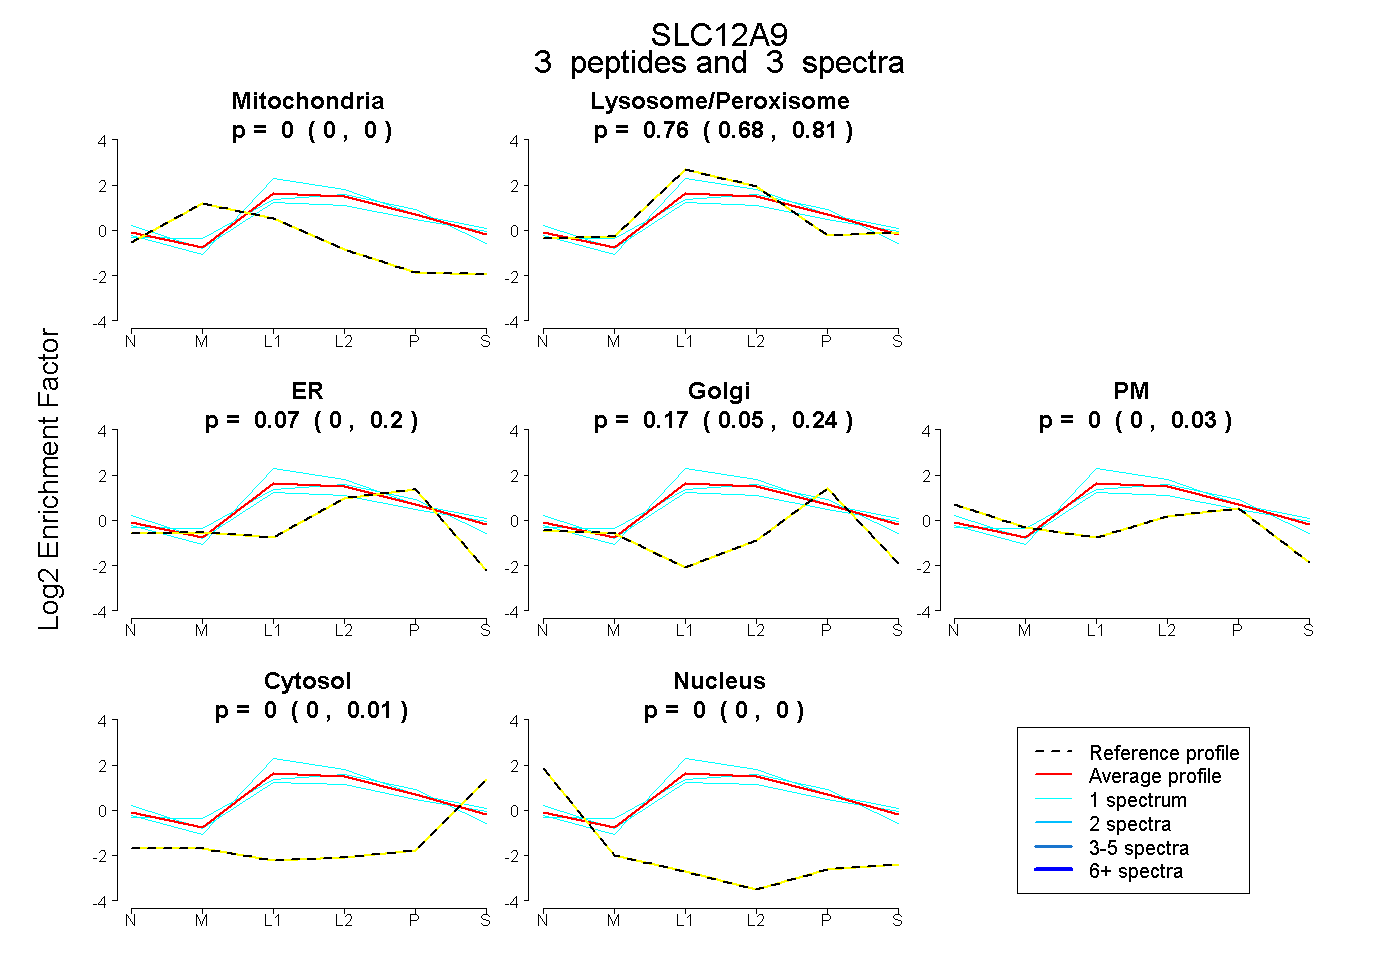 |
0.000 0.000 | 0.000 |
0.760 0.676 | 0.813 |
0.067 0.000 | 0.199 |
0.173 0.053 | 0.238 |
0.000 0.000 | 0.033 |
0.000 0.000 | 0.014 |
0.000 0.000 | 0.000 |
|||
| Plot | Lyso | Other | |||||||||||
| Expt C |
9 peptides |
25 spectra |
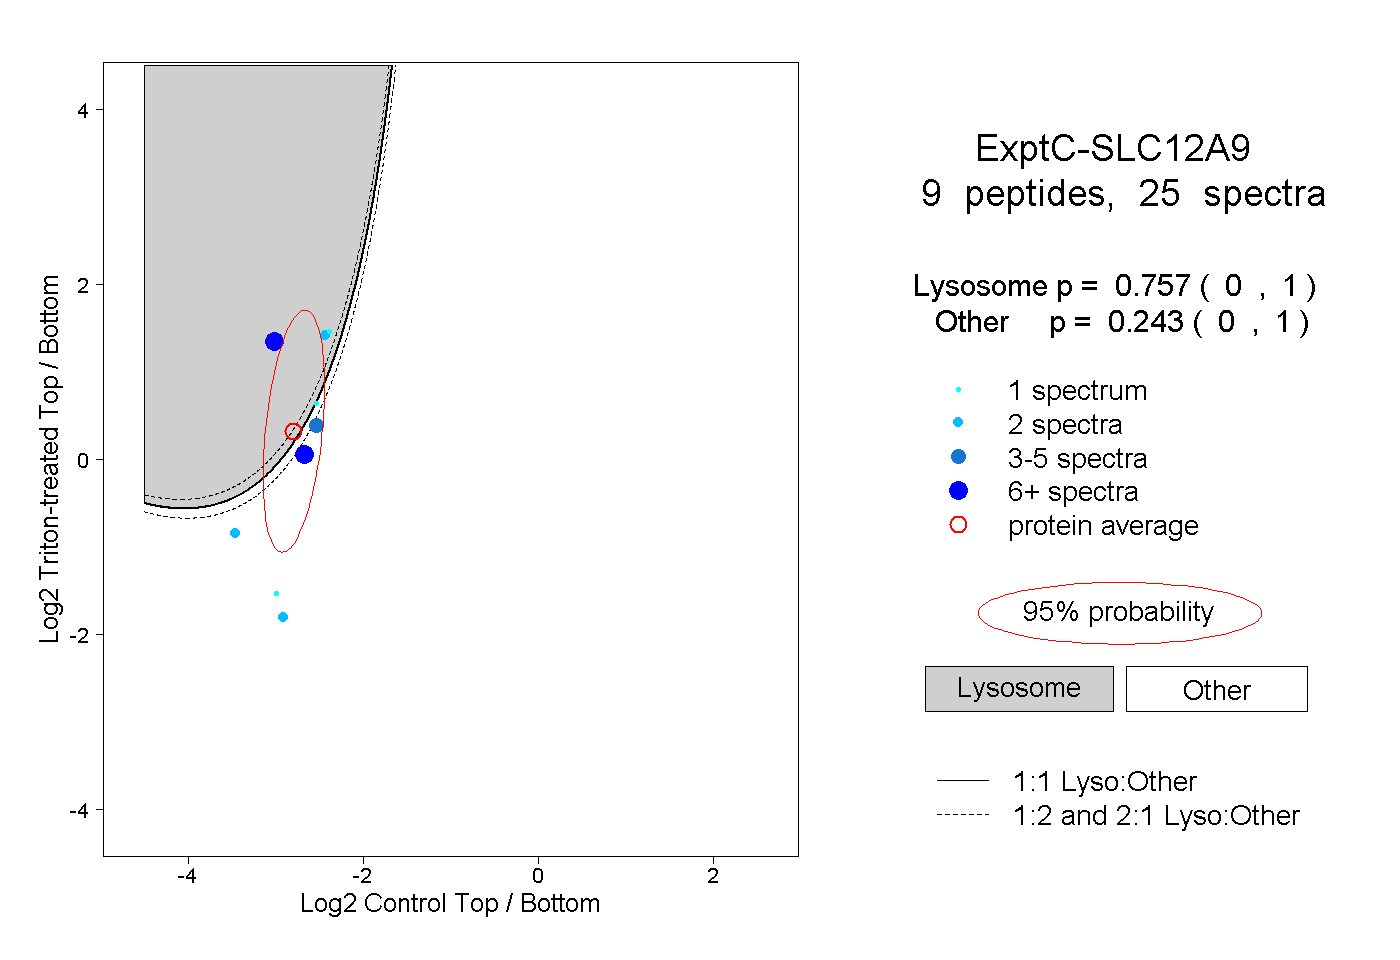 |
0.757 0.000 | 1.000 |
0.243 0.000 | 1.000 |
||||||||
| Plot | Lyso | Other | |||||||||||
| Expt D |
5 peptides |
7 spectra |
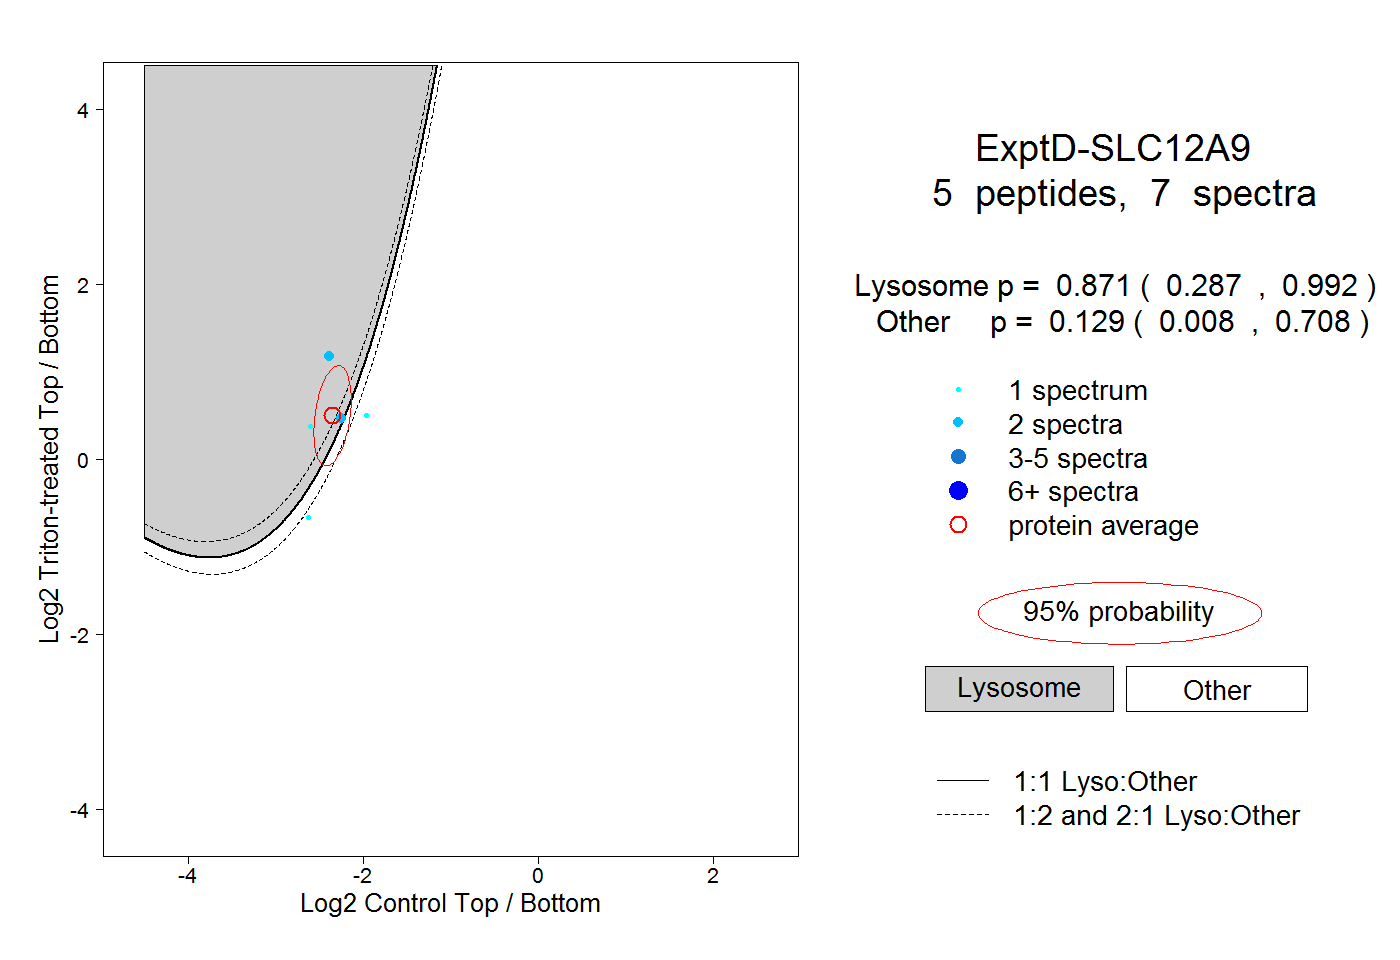 |
0.871 0.287 | 0.992 |
0.129 0.008 | 0.708 |