 3
3peptides
spectra
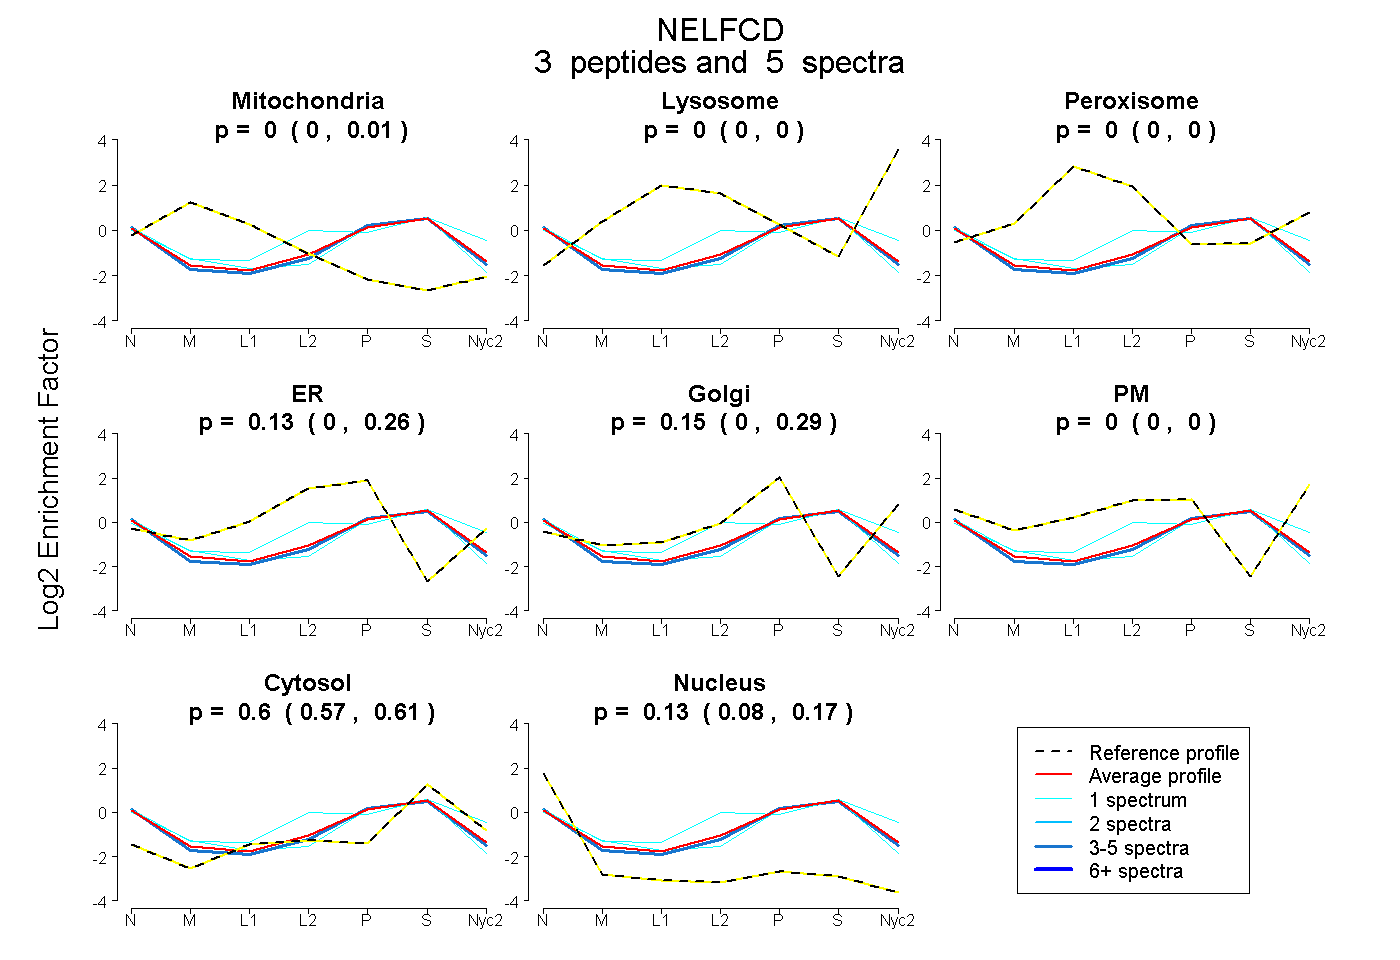
0.000 | 0.006
0.000 | 0.000
0.000 | 0.000
0.000 | 0.255
0.000 | 0.290
0.000 | 0.003
0.573 | 0.614
0.084 | 0.168
1peptide
spectra
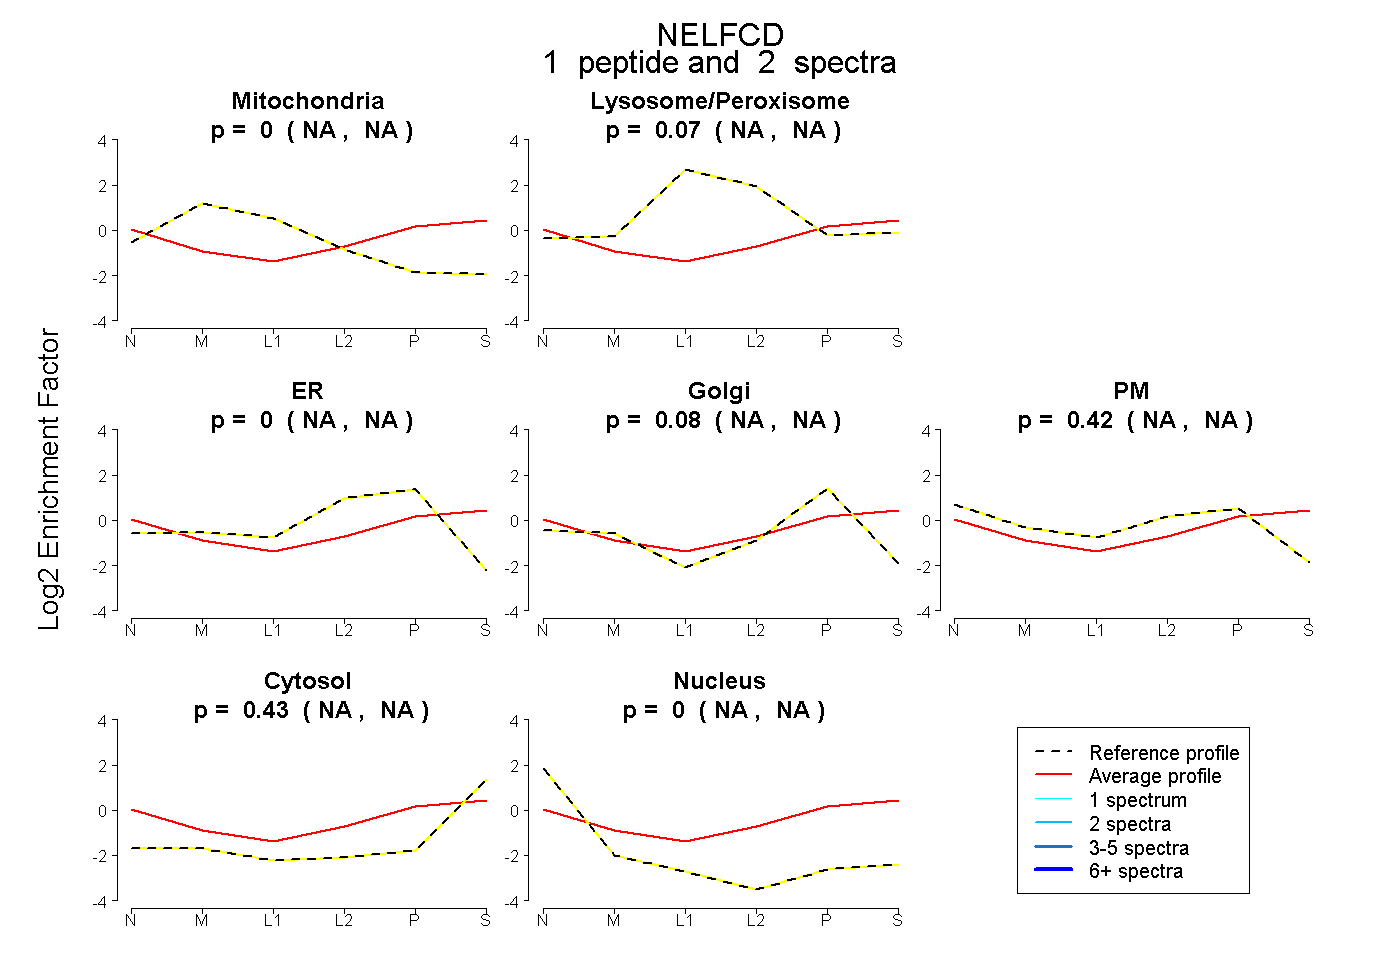
NA | NA
NA | NA
NA | NA
NA | NA
NA | NA
NA | NA
NA | NA
| Plot | Mito | Lyso | Perox | ER | Golgi | PM | Cytosol | Nucleus | |||||
| Expt A |
3 peptides |
5 spectra |
|
0.000 0.000 | 0.006 |
0.000 0.000 | 0.000 |
0.000 0.000 | 0.000 |
0.126 0.000 | 0.255 |
0.148 0.000 | 0.290 |
0.000 0.000 | 0.003 |
0.595 0.573 | 0.614 |
0.131 0.084 | 0.168 |
||
| Plot | Mito | Lyso or Perox | ER | Golgi | PM | Cytosol | Nucleus | ||||||
| Expt B |
1 peptide |
2 spectra |
|
0.000 NA | NA |
0.071 NA | NA |
0.000 NA | NA |
0.077 NA | NA |
0.423 NA | NA |
0.429 NA | NA |
0.000 NA | NA |