PHB
[ENSRNOP00000066502]
Main page
| | | Plot |
Mito |
Lyso |
|
Perox |
ER |
Golgi |
PM |
Cytosol |
Nucleus |
|
| Expt A |
 12
12
peptides |
101
spectra |
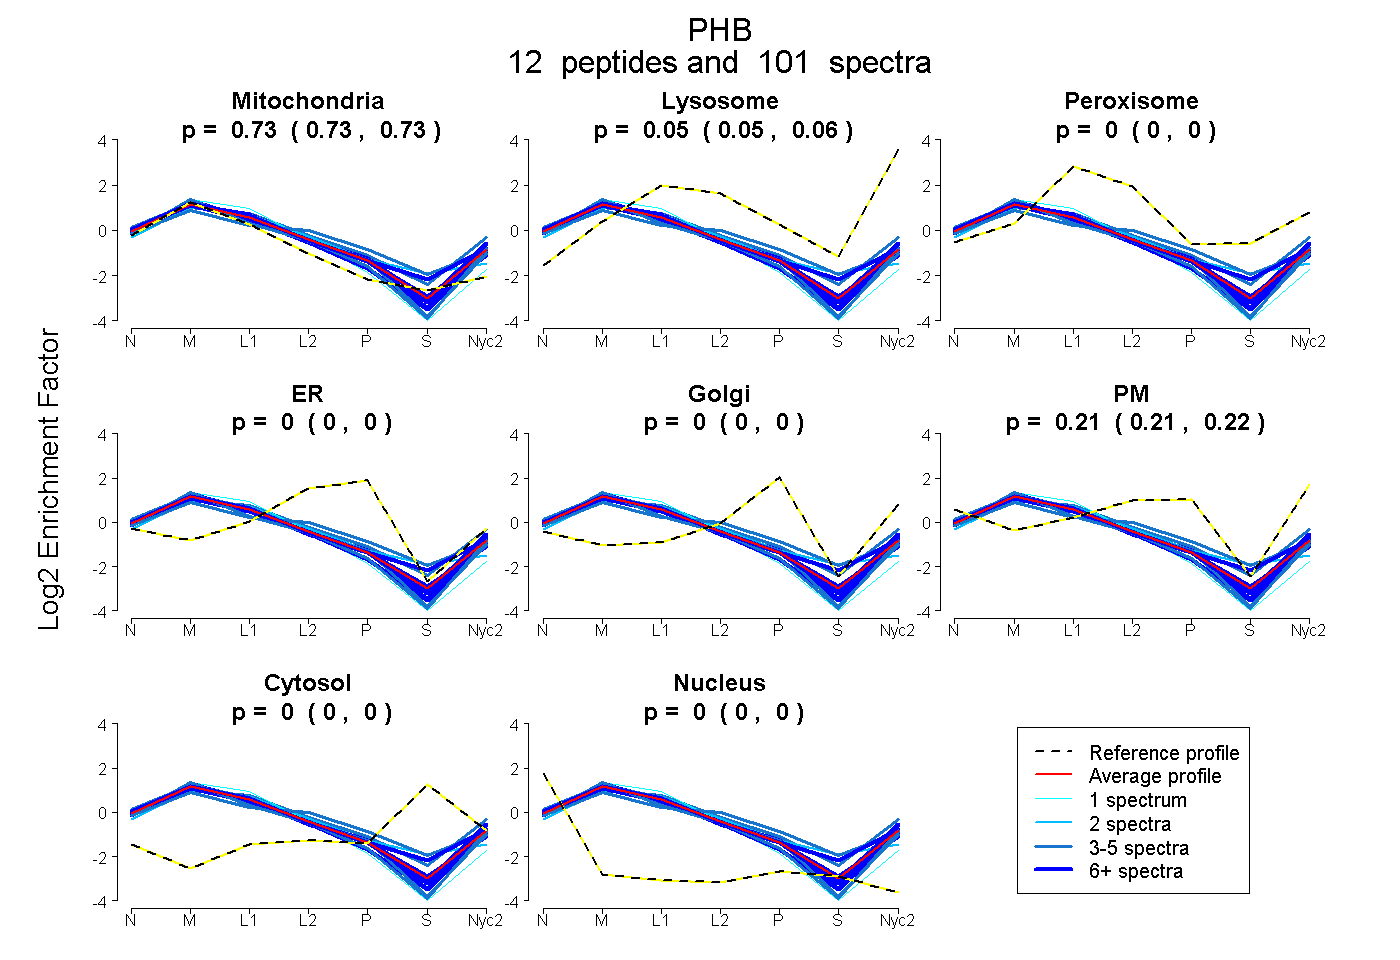 |
0.733
0.731 | 0.735 |
0.055
0.051 | 0.058 |
|
0.000
0.000 | 0.000 |
0.000
0.000 | 0.000 |
0.000
0.000 | 0.000 |
0.212
0.207 | 0.216 |
0.000
0.000 | 0.000 |
0.000
0.000 | 0.000 |
|
| | | Plot |
Mito |
|
Lyso or Perox |
|
ER |
Golgi |
PM |
Cytosol |
Nucleus |
|
| Expt B |
11
peptides |
89
spectra |
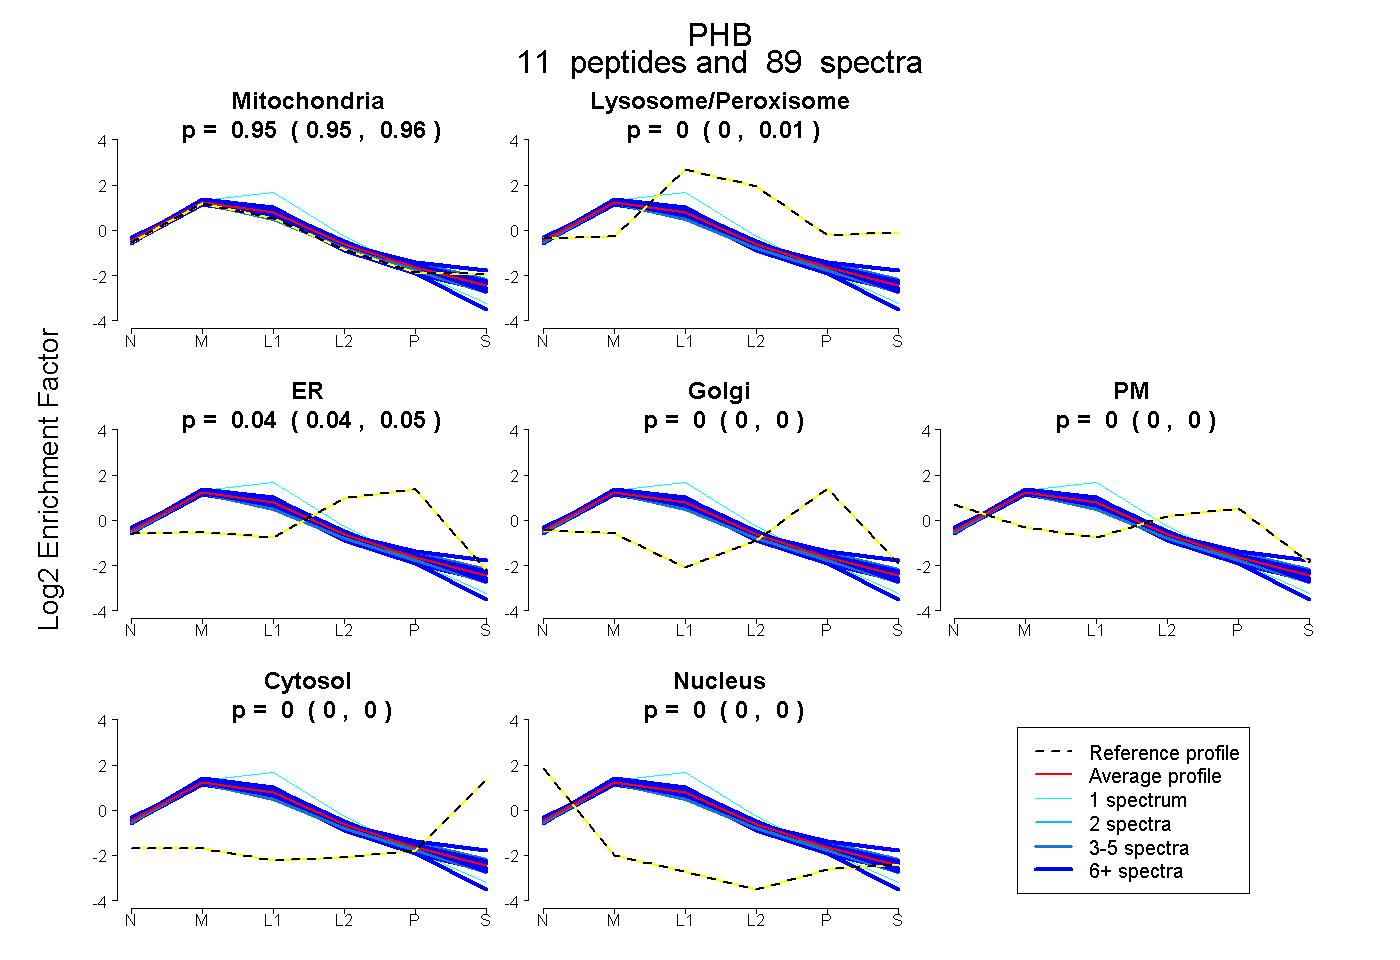 |
0.954
0.951 | 0.956 |
|
0.002
0.000 | 0.006 |
|
0.044
0.040 | 0.046 |
0.000
0.000 | 0.000 |
0.000
0.000 | 0.000 |
0.000
0.000 | 0.000 |
0.000
0.000 | 0.000 |
|
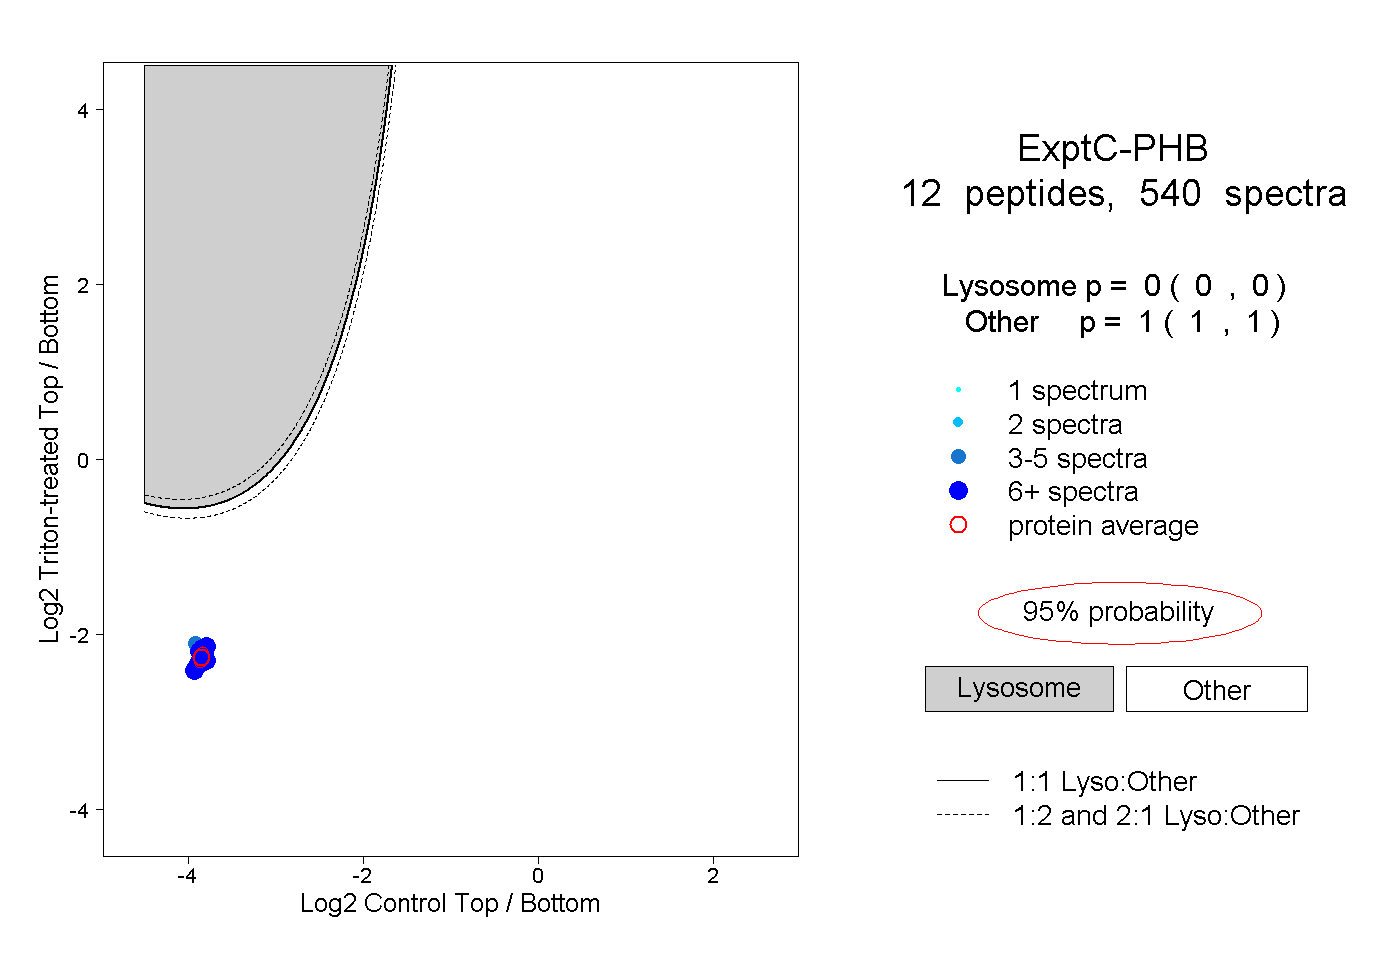
| | | Plot |
|
Lyso |
|
|
|
|
|
|
|
Other |
| Expt C |
12
peptides |
540
spectra |
 |
|
0.000
0.000 | 0.000 |
|
|
|
|
|
|
|
1.000
1.000 | 1.000 |
| 32 spectra, VLPSITTEILK |
|
0.000 |
|
|
|
|
|
|
|
1.000 |
| 27 spectra, EFTEAVEAK |
|
0.000 |
|
|
|
|
|
|
|
1.000 |
| 24 spectra, VFESIGK |
|
0.000 |
|
|
|
|
|
|
|
1.000 |
| 41 spectra, AVIFDR |
|
0.000 |
|
|
|
|
|
|
|
1.000 |
| 55 spectra, IYTSIGEDYDER |
|
0.000 |
|
|
|
|
|
|
|
1.000 |
| 4 spectra, LEAAEDIAYQLSR |
|
0.000 |
|
|
|
|
|
|
|
1.000 |
| 88 spectra, QVSDDLTER |
|
0.000 |
|
|
|
|
|
|
|
1.000 |
| 37 spectra, DLQNVNITLR |
|
0.000 |
|
|
|
|
|
|
|
1.000 |
| 50 spectra, AAIISAEGDSK |
|
0.000 |
|
|
|
|
|
|
|
1.000 |
| 78 spectra, NVPVITGSK |
|
0.000 |
|
|
|
|
|
|
|
1.000 |
| 46 spectra, FDAGELITQR |
|
0.000 |
|
|
|
|
|
|
|
1.000 |
| 58 spectra, ILFRPVASQLPR |
|
0.000 |
|
|
|
|
|
|
|
1.000 |
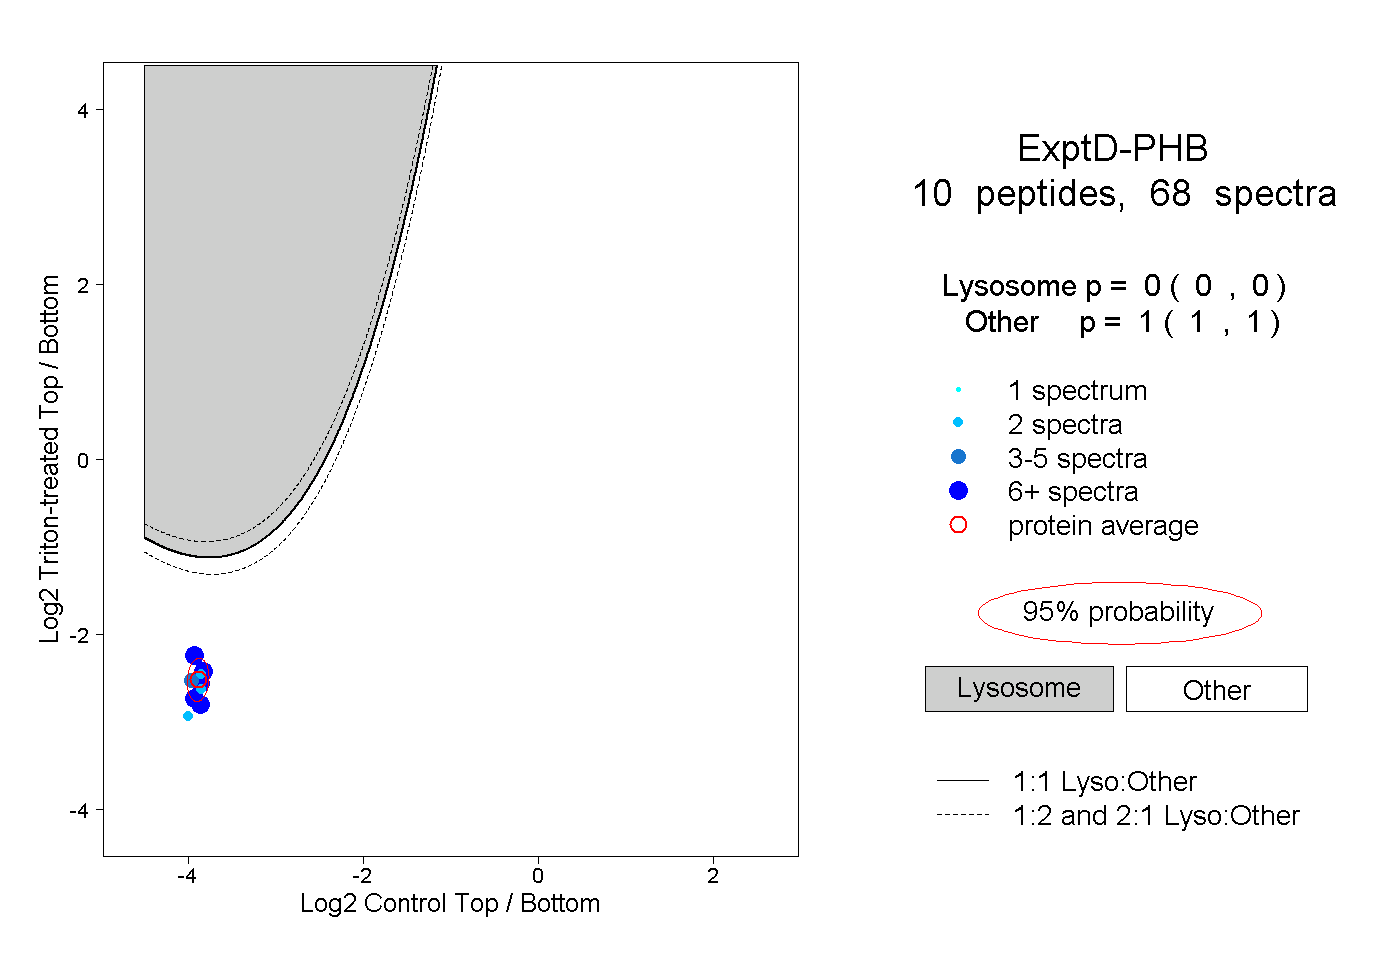
| | | Plot |
|
Lyso |
|
|
|
|
|
|
|
Other |
| Expt D |
10
peptides |
68
spectra |
 |
|
0.000
0.000 | 0.000 |
|
|
|
|
|
|
|
1.000
1.000 | 1.000 |