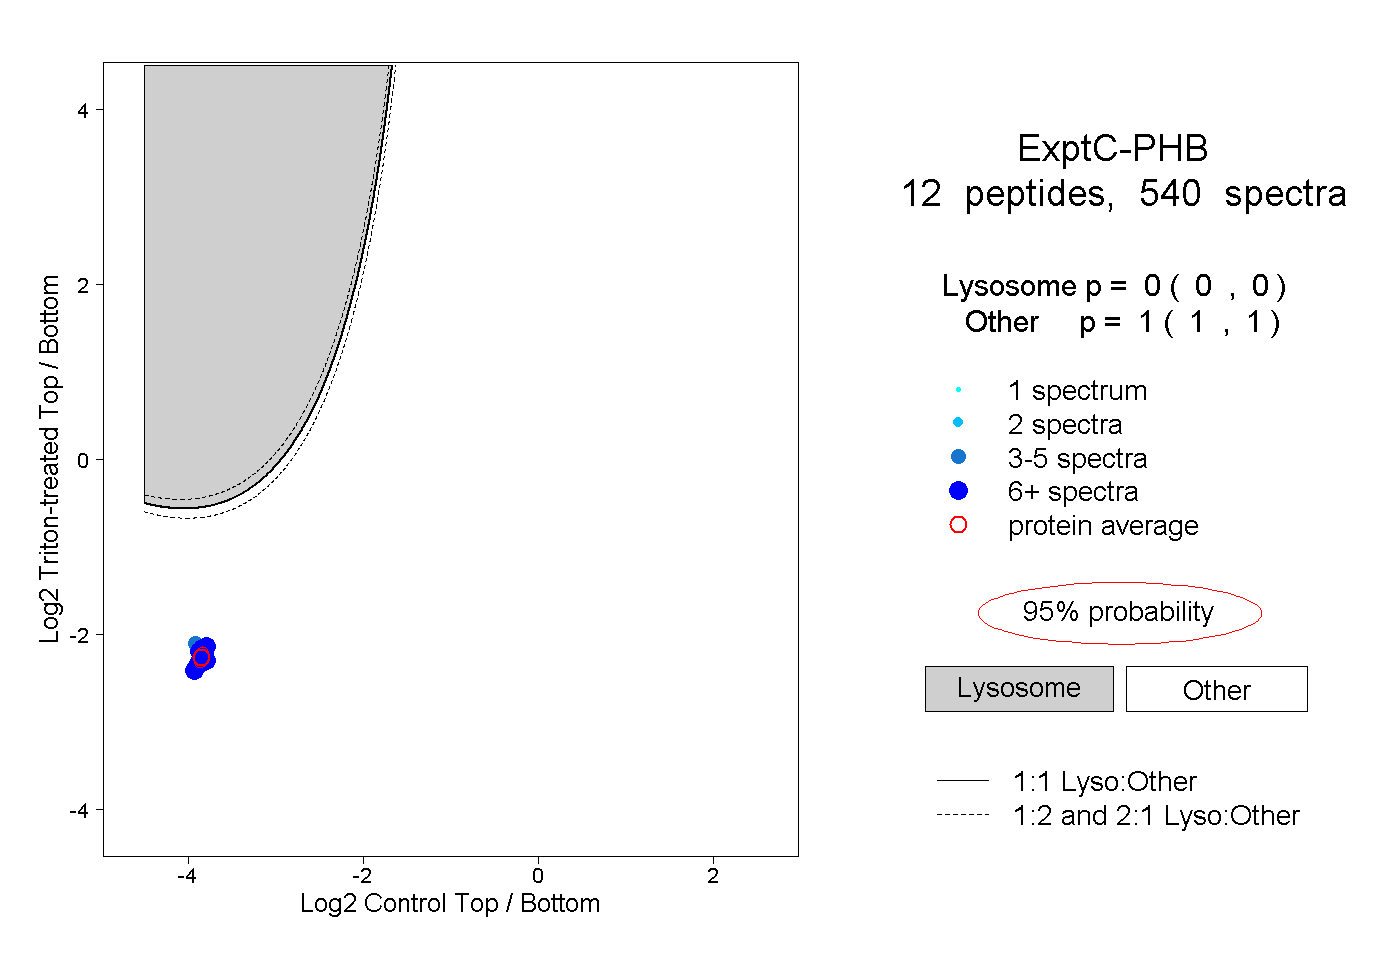
12
12peptides
spectra
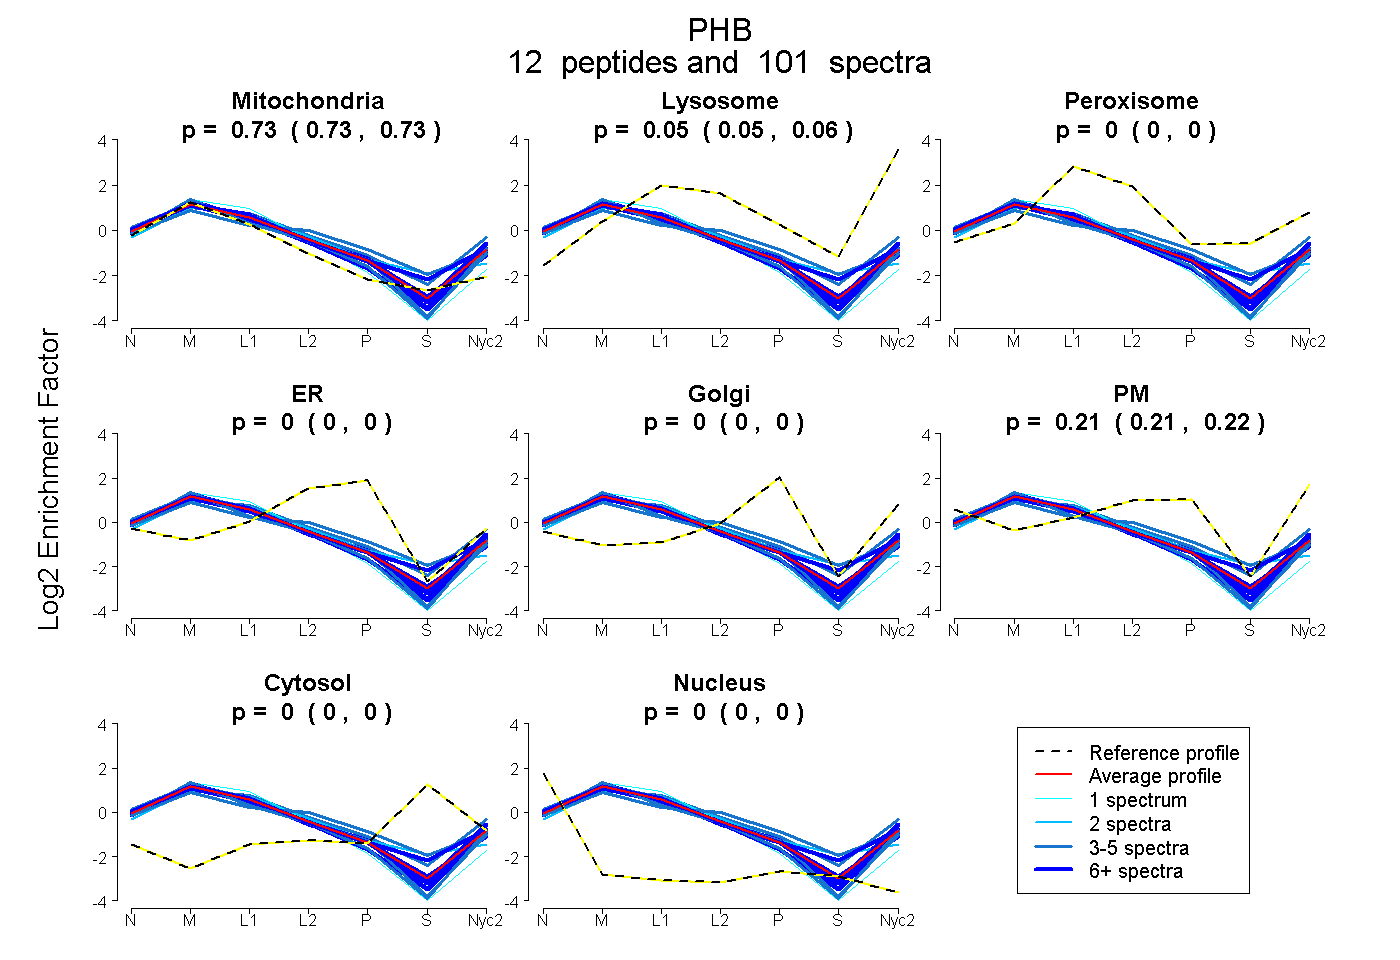
0.731 | 0.735
0.051 | 0.058
0.000 | 0.000
0.000 | 0.000
0.000 | 0.000
0.207 | 0.216
0.000 | 0.000
0.000 | 0.000
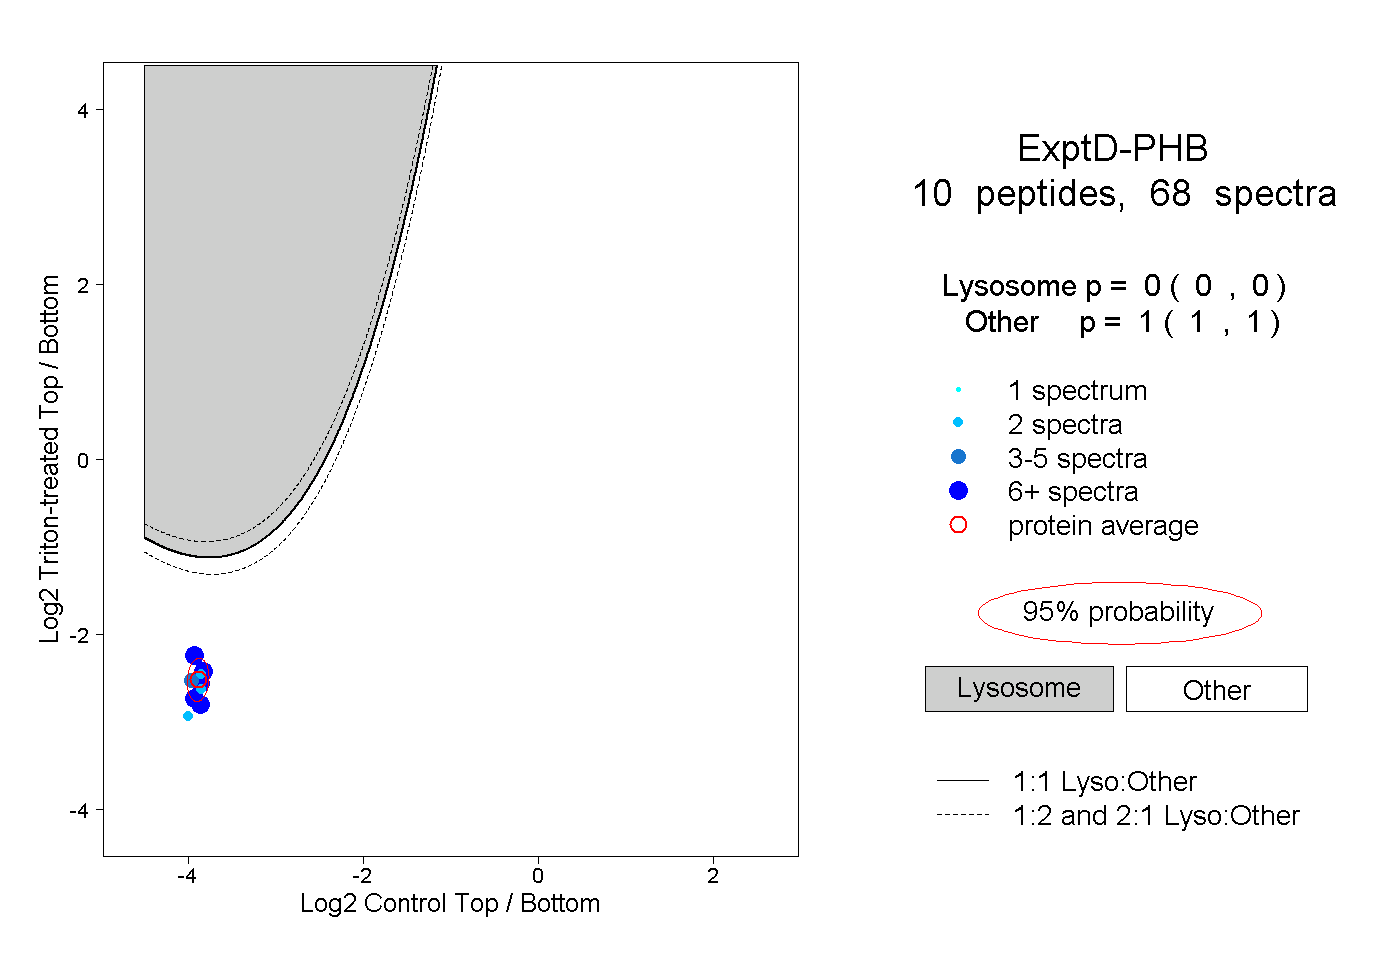
11peptides
spectra
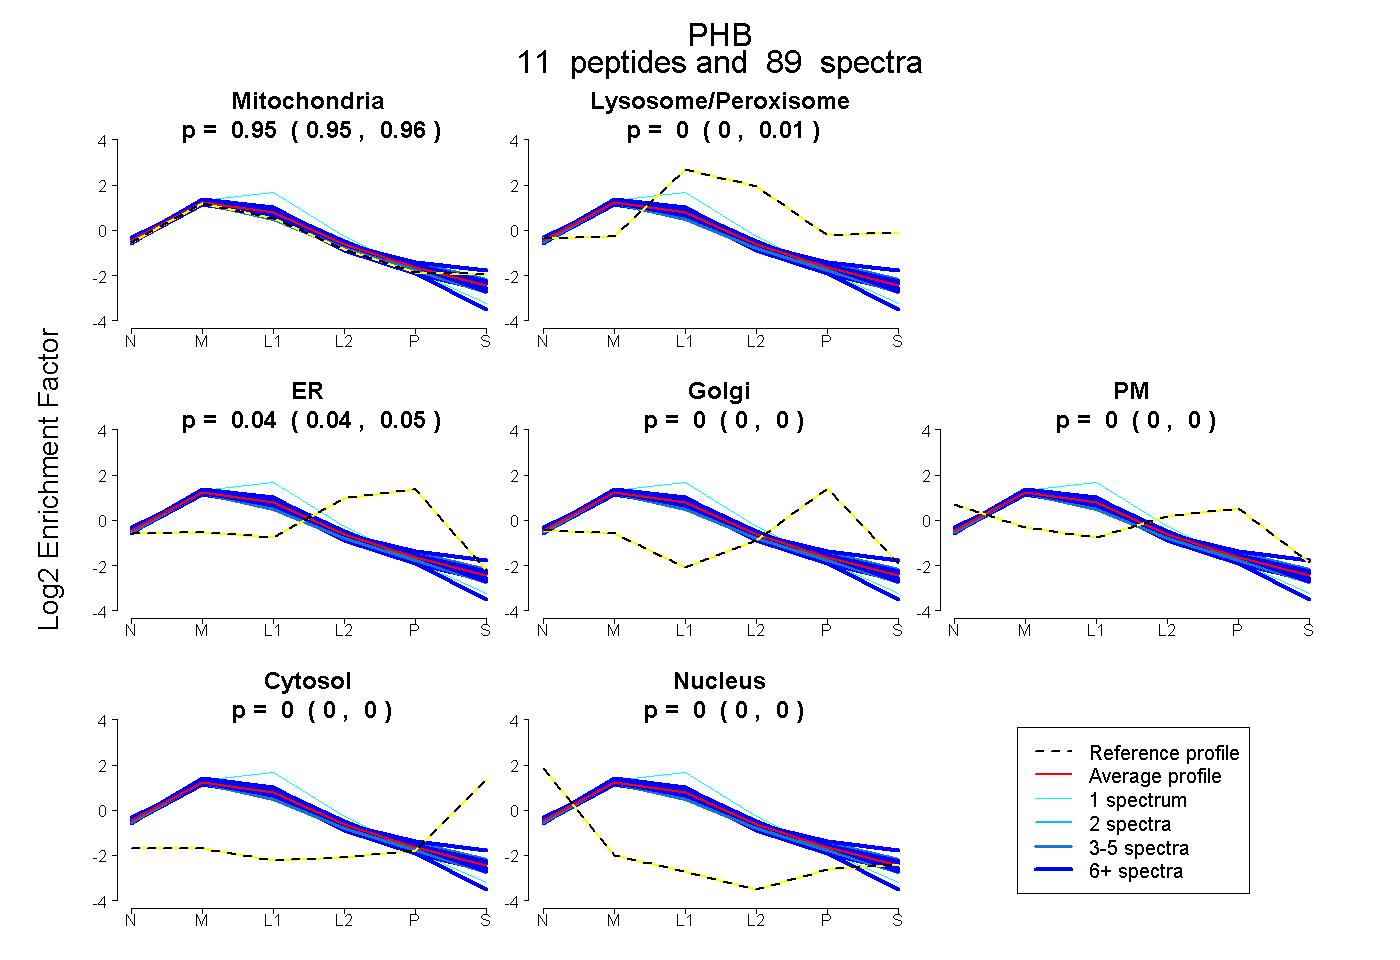
0.951 | 0.956
0.000 | 0.006
0.040 | 0.046
0.000 | 0.000
0.000 | 0.000
0.000 | 0.000
0.000 | 0.000