 3
3peptides
spectra
0.000 | 0.000
0.000 | 0.011
0.140 | 0.224
0.000 | 0.138
0.130 | 0.315
0.375 | 0.556
0.024 | 0.072
0.000 | 0.000
| Plot | Mito | Lyso | Perox | ER | Golgi | PM | Cytosol | Nucleus | |||||
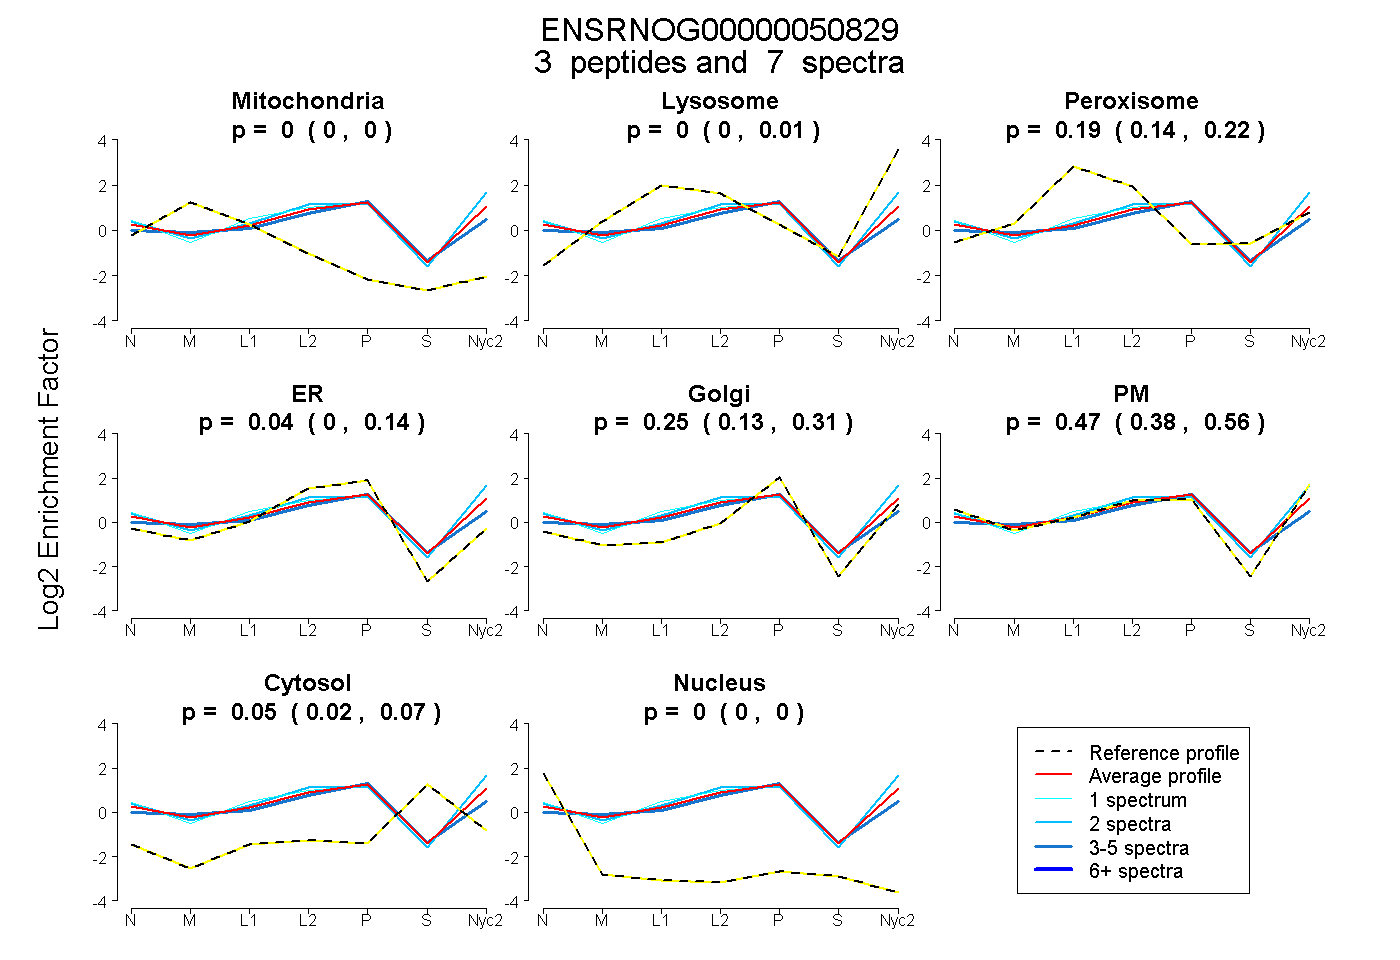
| Expt A |
3 peptides |
7 spectra |
|
0.000 0.000 | 0.000 |
0.000 0.000 | 0.011 |
0.193 0.140 | 0.224 |
0.037 0.000 | 0.138 |
0.249 0.130 | 0.315 |
0.474 0.375 | 0.556 |
0.047 0.024 | 0.072 |
0.000 0.000 | 0.000 |
| 2 spectra, QILEALR | 0.000 | 0.093 | 0.042 | 0.036 | 0.000 | 0.777 | 0.052 | 0.000 | ||
| 1 spectrum, YCHDNNIIHR | 0.000 | 0.000 | 0.178 | 0.123 | 0.084 | 0.547 | 0.068 | 0.000 | ||
| 4 spectra, ADAGFVYSEAVASHYMR | 0.020 | 0.000 | 0.239 | 0.155 | 0.384 | 0.150 | 0.052 | 0.000 |
| Plot | Mito | Lyso or Perox | ER | Golgi | PM | Cytosol | Nucleus | ||||||
| Expt B |
1 peptide |
2 spectra |
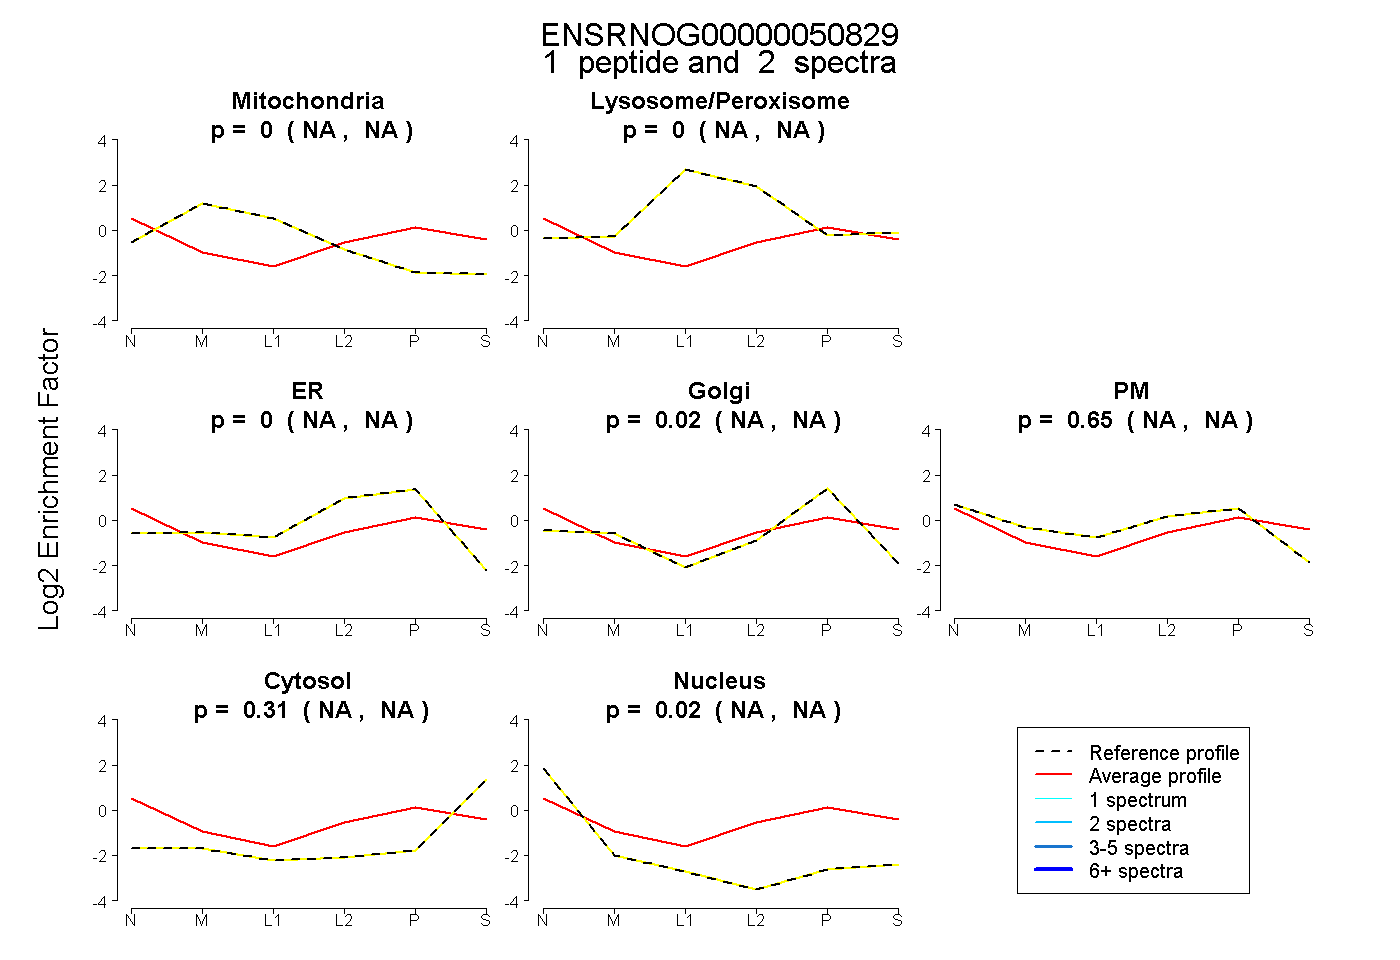 |
0.000 NA | NA |
0.000 NA | NA |
0.000 NA | NA |
0.022 NA | NA |
0.655 NA | NA |
0.308 NA | NA |
0.016 NA | NA |
|||
| Plot | Lyso | Other | |||||||||||
| Expt C |
4 peptides |
15 spectra |
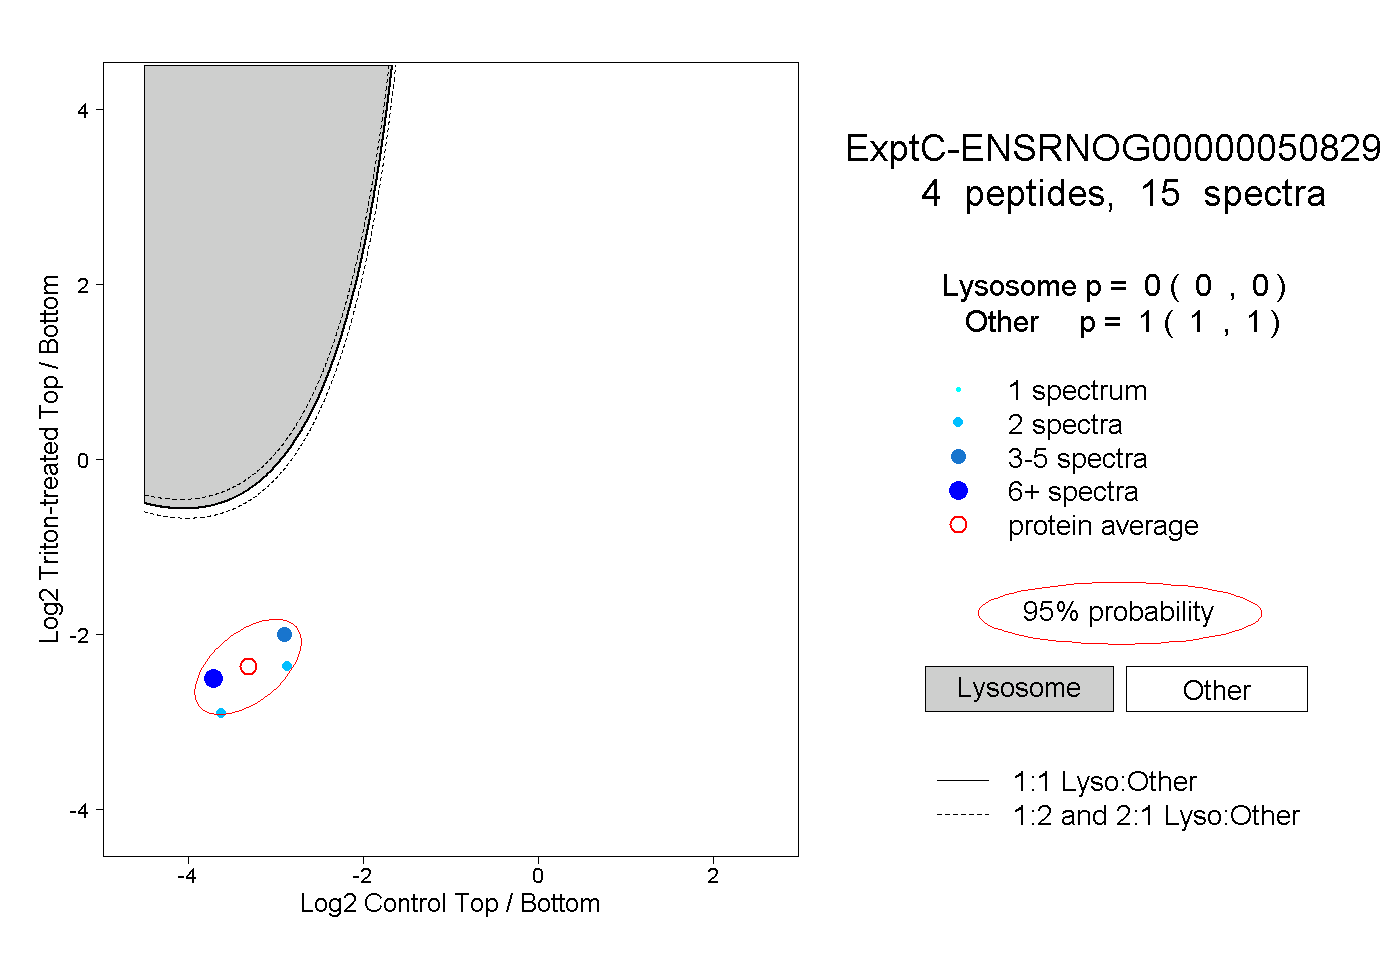 |
0.000 0.000 | 0.000 |
1.000 1.000 | 1.000 |