 8
8peptides
spectra
0.000 | 0.000
0.150 | 0.175
0.003 | 0.027
0.000 | 0.000
0.000 | 0.000
0.040 | 0.056
0.765 | 0.776
0.000 | 0.000
| Plot | Mito | Lyso | Perox | ER | Golgi | PM | Cytosol | Nucleus | |||||
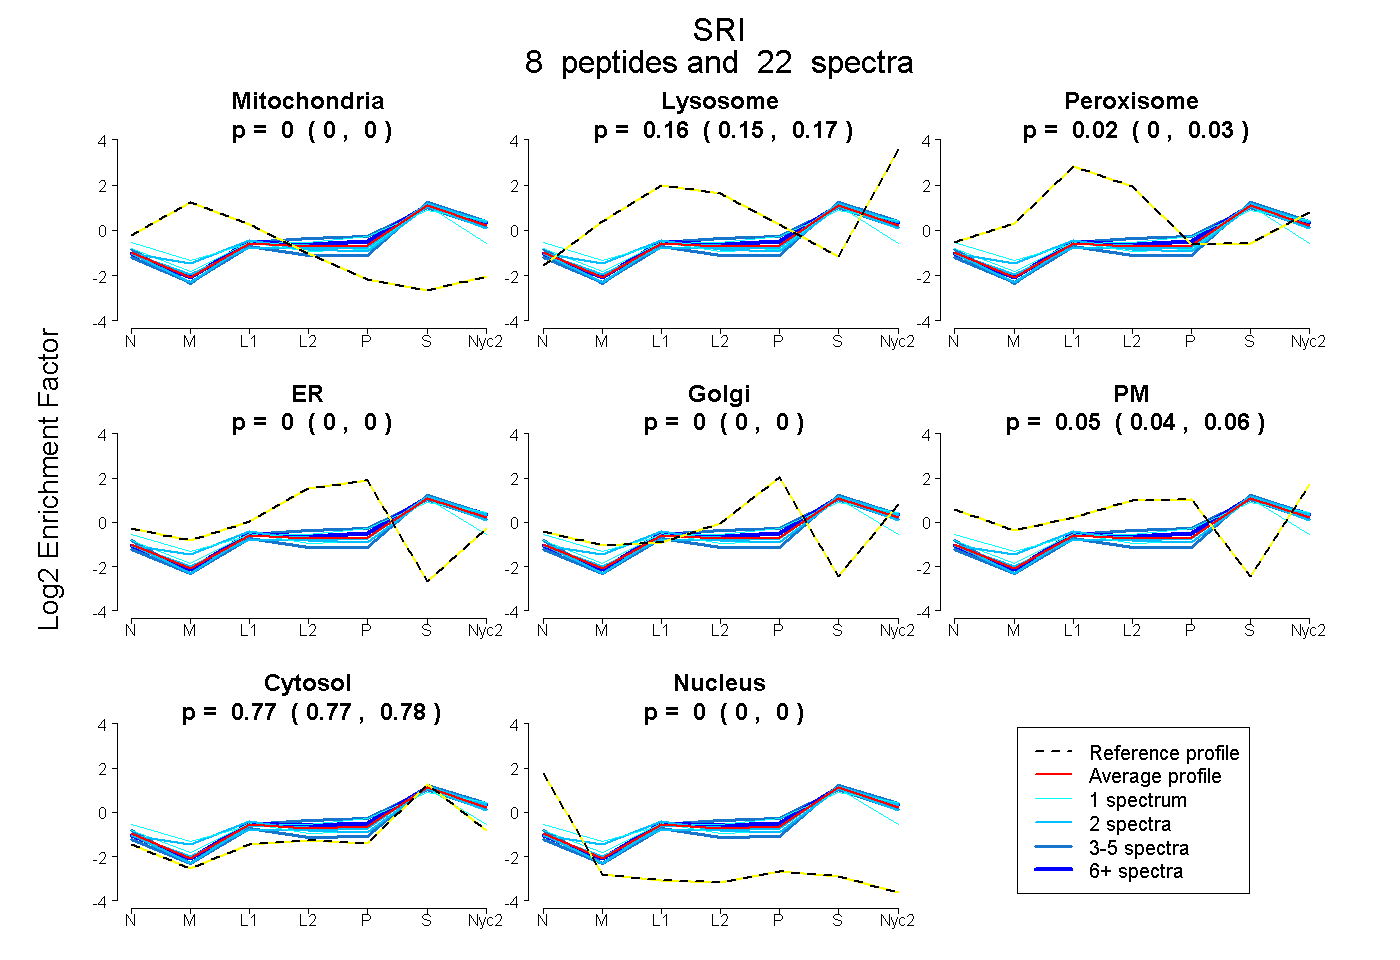
| Expt A |
8 peptides |
22 spectra |
|
0.000 0.000 | 0.000 |
0.164 0.150 | 0.175 |
0.016 0.003 | 0.027 |
0.000 0.000 | 0.000 |
0.000 0.000 | 0.000 |
0.048 0.040 | 0.056 |
0.771 0.765 | 0.776 |
0.000 0.000 | 0.000 |
| 2 spectra, LMVSMLDR | 0.000 | 0.144 | 0.110 | 0.000 | 0.000 | 0.000 | 0.745 | 0.000 | ||
| 1 spectrum, ITFDDYIACCVK | 0.000 | 0.000 | 0.174 | 0.000 | 0.025 | 0.016 | 0.781 | 0.005 | ||
| 6 spectra, ALTTMGFR | 0.000 | 0.208 | 0.000 | 0.000 | 0.000 | 0.039 | 0.753 | 0.000 | ||
| 5 spectra, ALTDSFR | 0.000 | 0.116 | 0.023 | 0.038 | 0.000 | 0.096 | 0.727 | 0.000 | ||
| 2 spectra, ELWTVLSGWR | 0.000 | 0.183 | 0.000 | 0.000 | 0.000 | 0.030 | 0.787 | 0.000 | ||
| 2 spectra, SGTVDPQELQK | 0.000 | 0.198 | 0.000 | 0.000 | 0.000 | 0.018 | 0.785 | 0.000 | ||
| 3 spectra, DMSGTMGFSEFR | 0.000 | 0.167 | 0.000 | 0.000 | 0.000 | 0.000 | 0.833 | 0.000 | ||
| 1 spectrum, YSTSGK | 0.000 | 0.131 | 0.026 | 0.000 | 0.000 | 0.193 | 0.650 | 0.000 |
| Plot | Mito | Lyso or Perox | ER | Golgi | PM | Cytosol | Nucleus | ||||||
| Expt B |
2 peptides |
3 spectra |
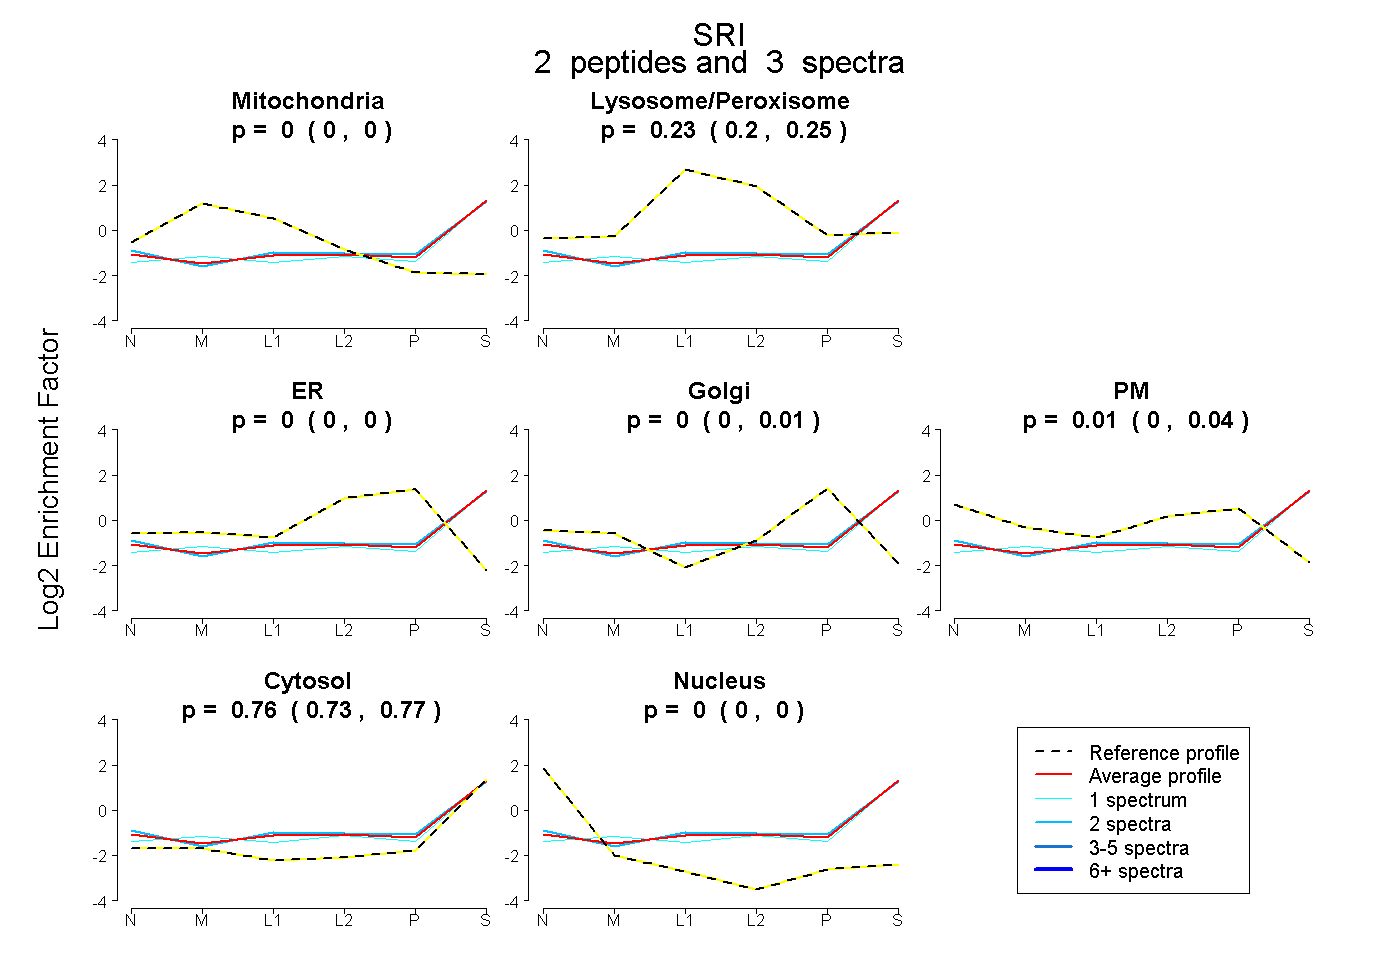 |
0.000 0.000 | 0.000 |
0.233 0.201 | 0.254 |
0.000 0.000 | 0.000 |
0.000 0.000 | 0.007 |
0.011 0.000 | 0.039 |
0.756 0.734 | 0.770 |
0.000 0.000 | 0.004 |
|||
| Plot | Lyso | Other | |||||||||||
| Expt C |
8 peptides |
31 spectra |
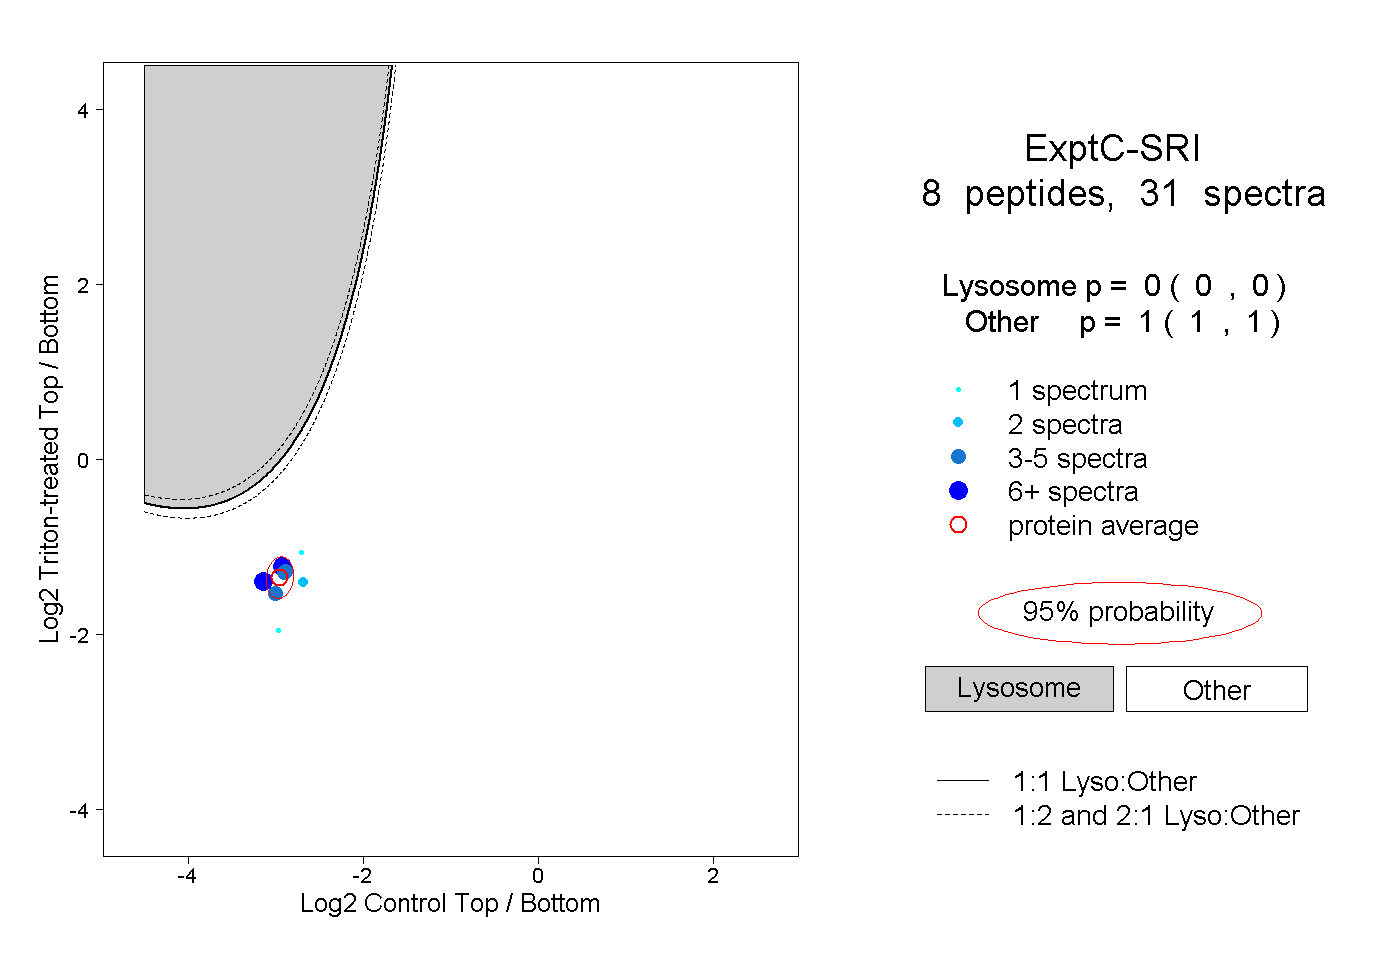 |
0.000 0.000 | 0.000 |
1.000 1.000 | 1.000 |
||||||||
| Plot | Lyso | Other | |||||||||||
| Expt D |
2 peptides |
7 spectra |
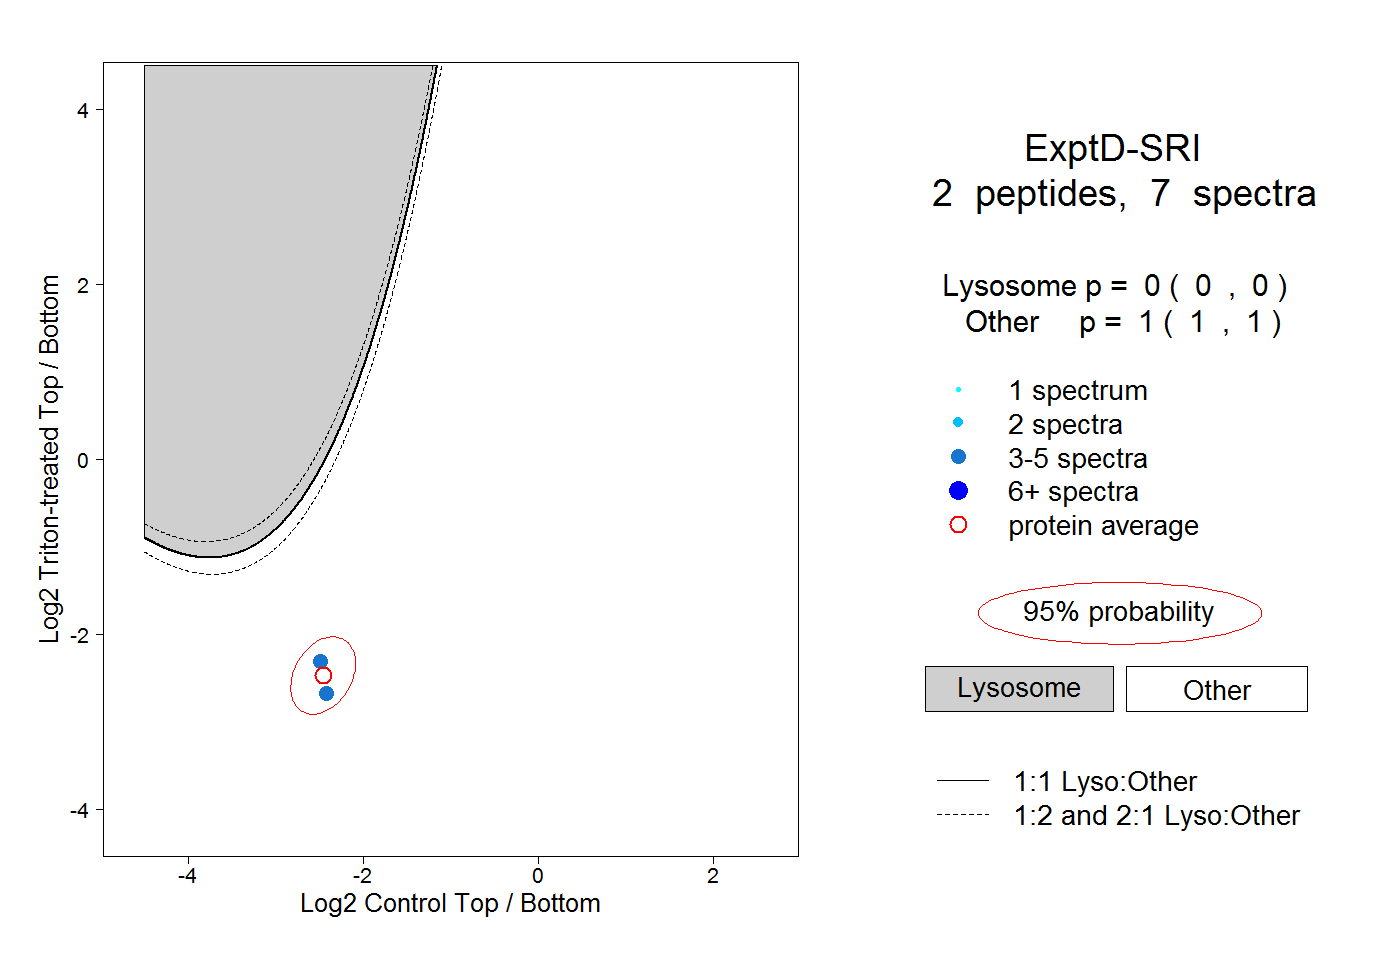 |
0.000 0.000 | 0.000 |
1.000 1.000 | 1.000 |