 2
2peptides
spectra
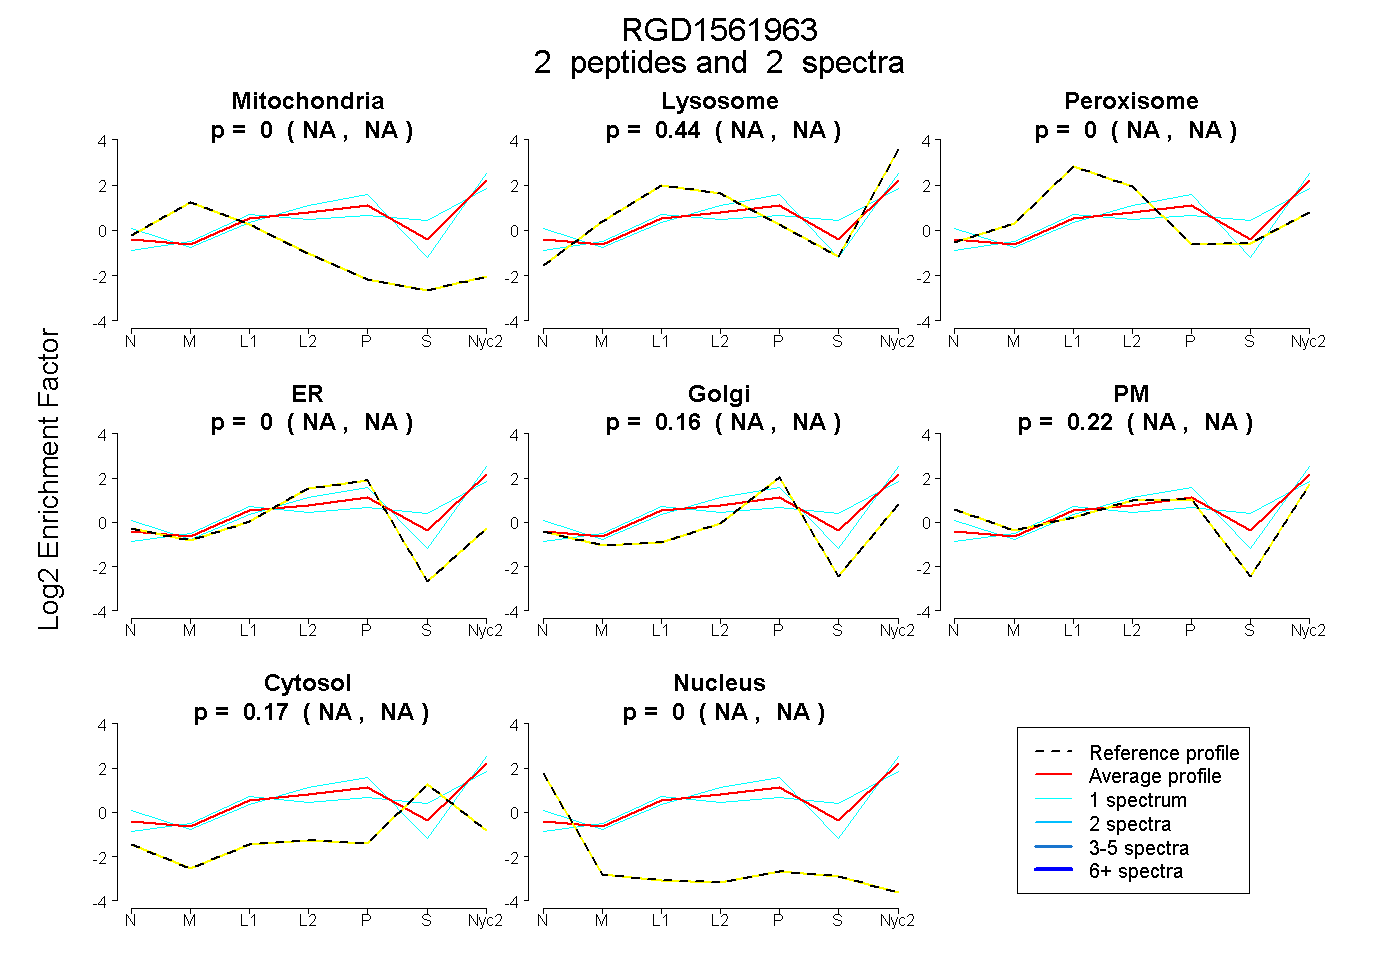
NA | NA
NA | NA
NA | NA
NA | NA
NA | NA
NA | NA
NA | NA
NA | NA
3peptides
spectra
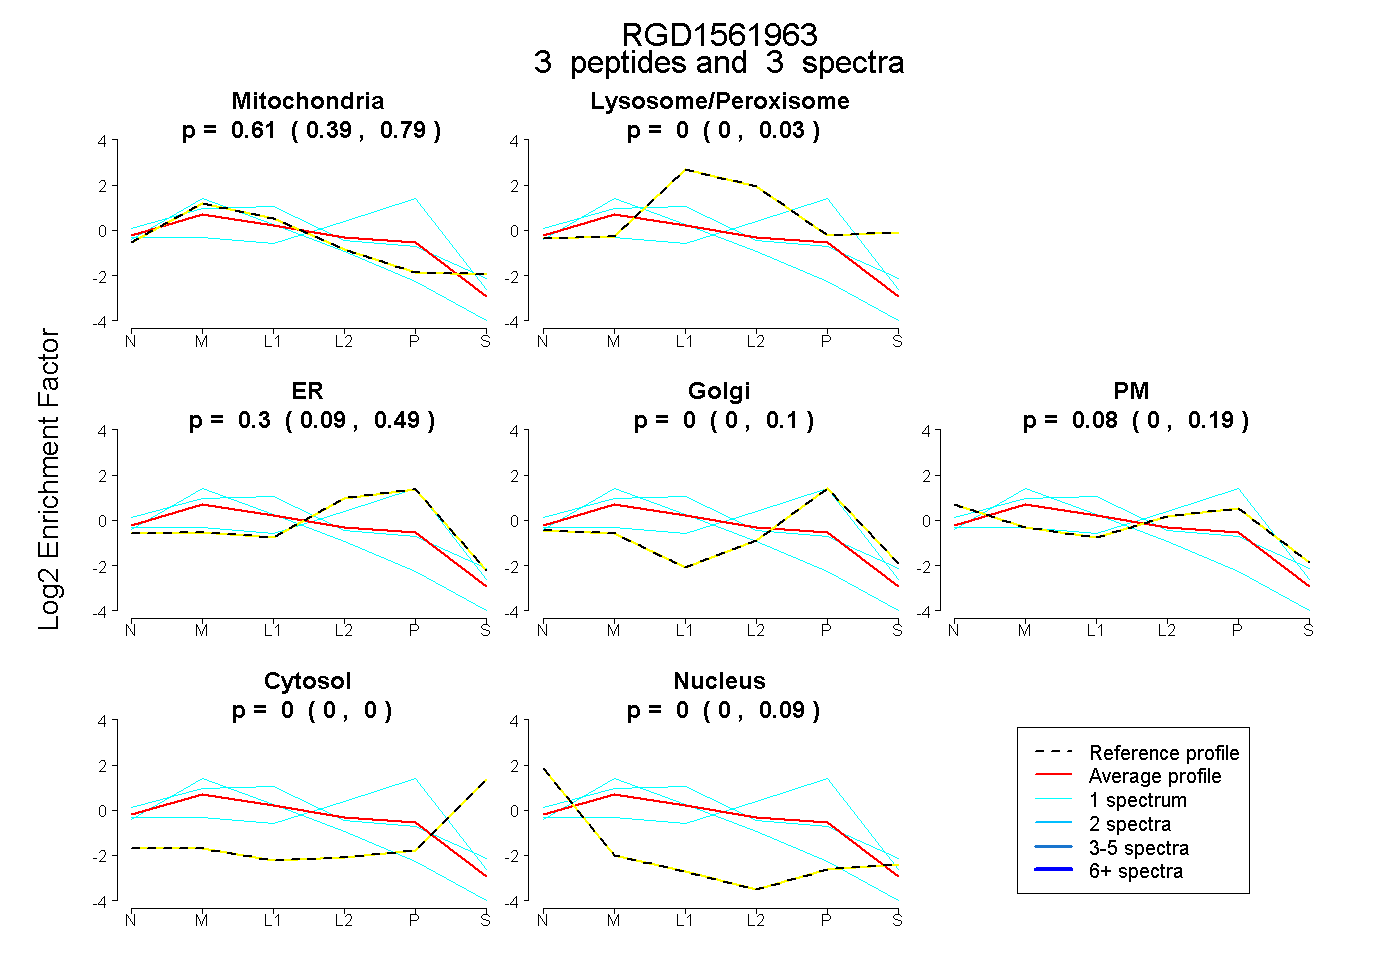
0.387 | 0.793
0.000 | 0.032
0.085 | 0.494
0.000 | 0.103
0.000 | 0.189
0.000 | 0.000
0.000 | 0.090
4peptides
spectra
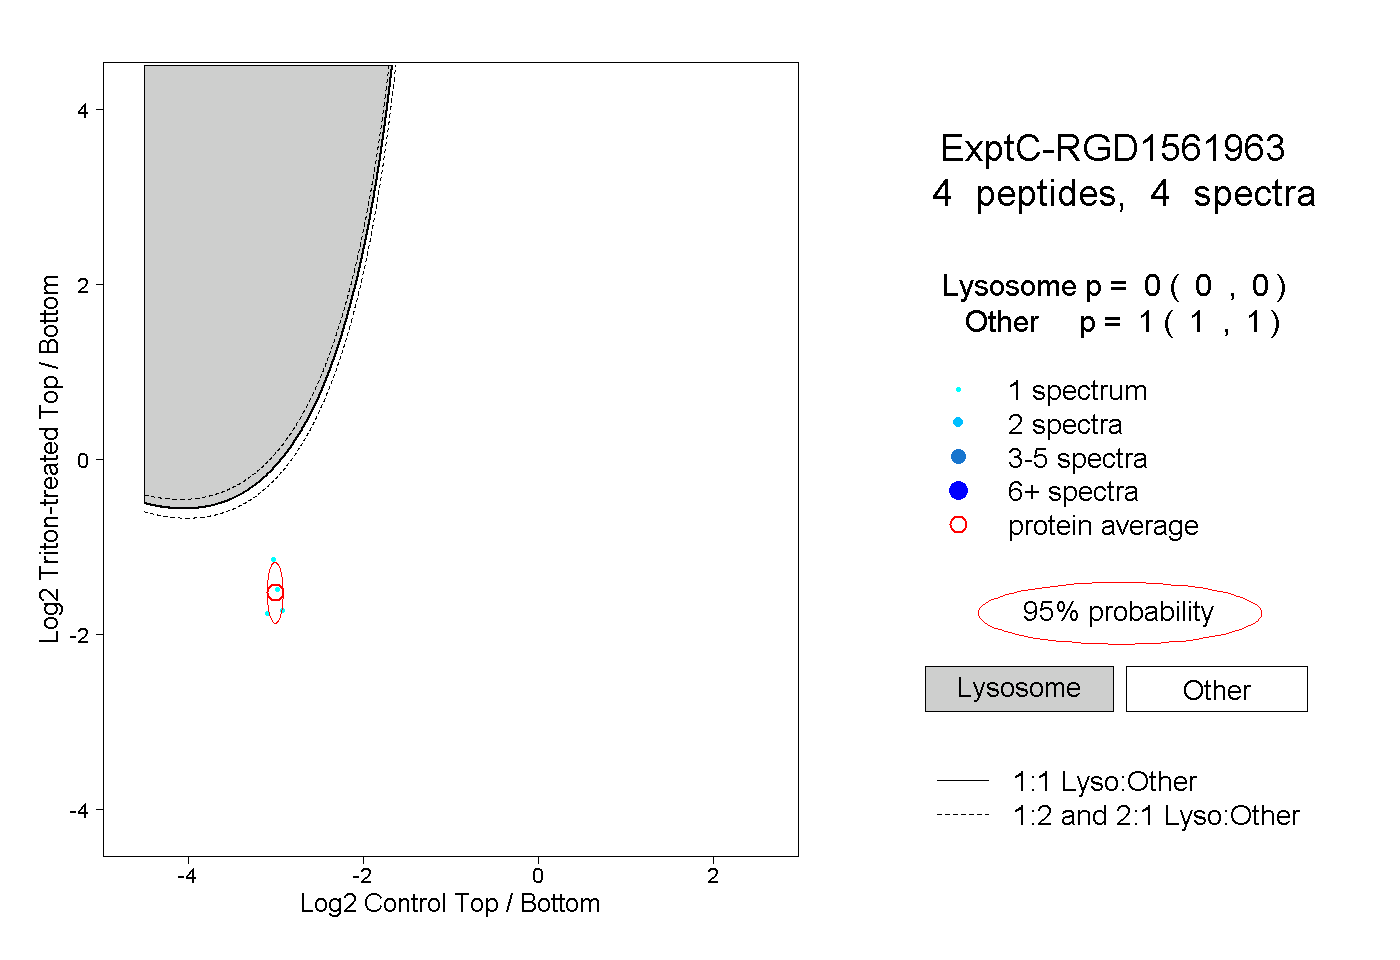
0.000 | 0.000
1.000 | 1.000
1peptide
spectrum
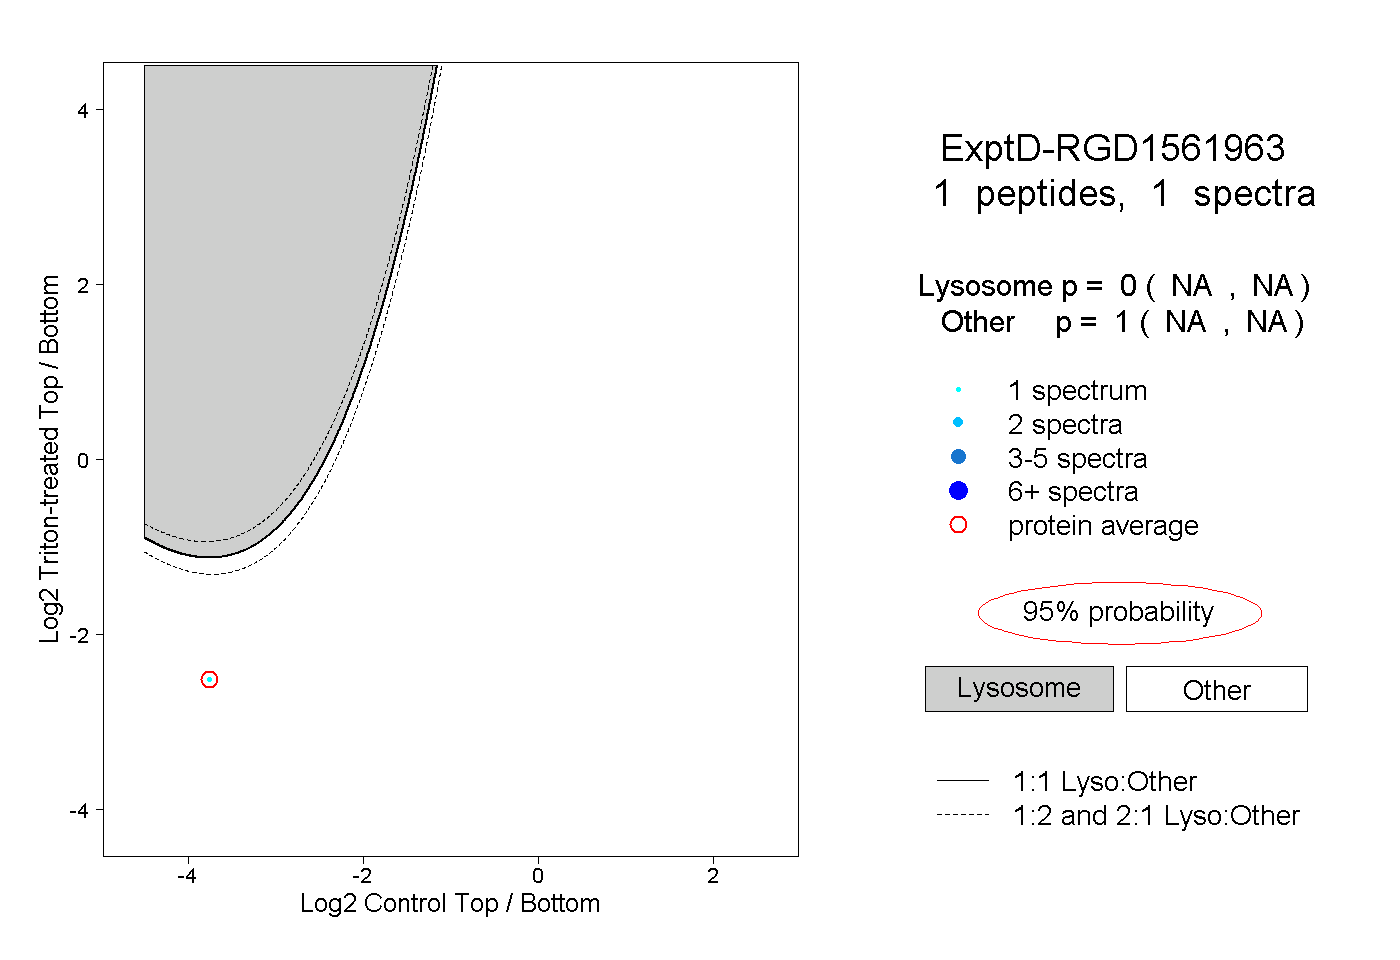
NA | NA
NA | NA