 2
2peptides
spectra
0.000 | 0.043
0.000 | 0.042
0.060 | 0.206
0.000 | 0.115
0.000 | 0.183
0.000 | 0.087
0.620 | 0.746
0.000 | 0.000
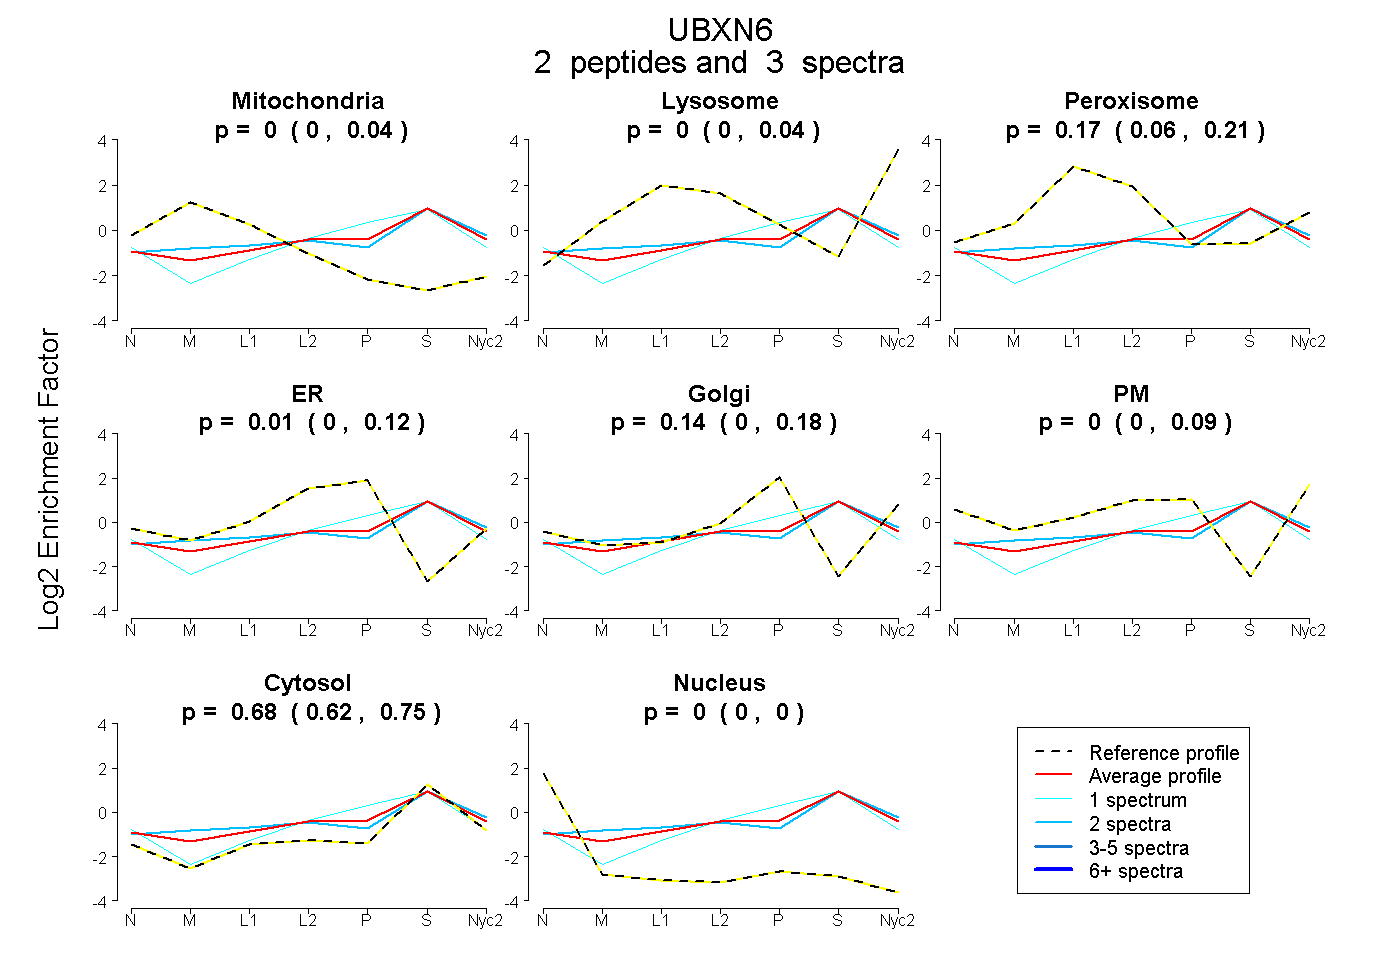
| Plot | Mito | Lyso | Perox | ER | Golgi | PM | Cytosol | Nucleus | |||||
| Expt A |
2 peptides |
3 spectra |
|
0.000 0.000 | 0.043 |
0.000 0.000 | 0.042 |
0.172 0.060 | 0.206 |
0.009 0.000 | 0.115 |
0.139 0.000 | 0.183 |
0.000 0.000 | 0.087 |
0.680 0.620 | 0.746 |
0.000 0.000 | 0.000 |
| 1 spectrum, GPTSQDSIR | 0.000 | 0.000 | 0.000 | 0.229 | 0.044 | 0.000 | 0.728 | 0.000 | ||
| 2 spectra, AQPQNLER | 0.063 | 0.097 | 0.151 | 0.000 | 0.031 | 0.000 | 0.658 | 0.000 |
| Plot | Lyso | Other | |||||||||||
| Expt C |
2 peptides |
3 spectra |
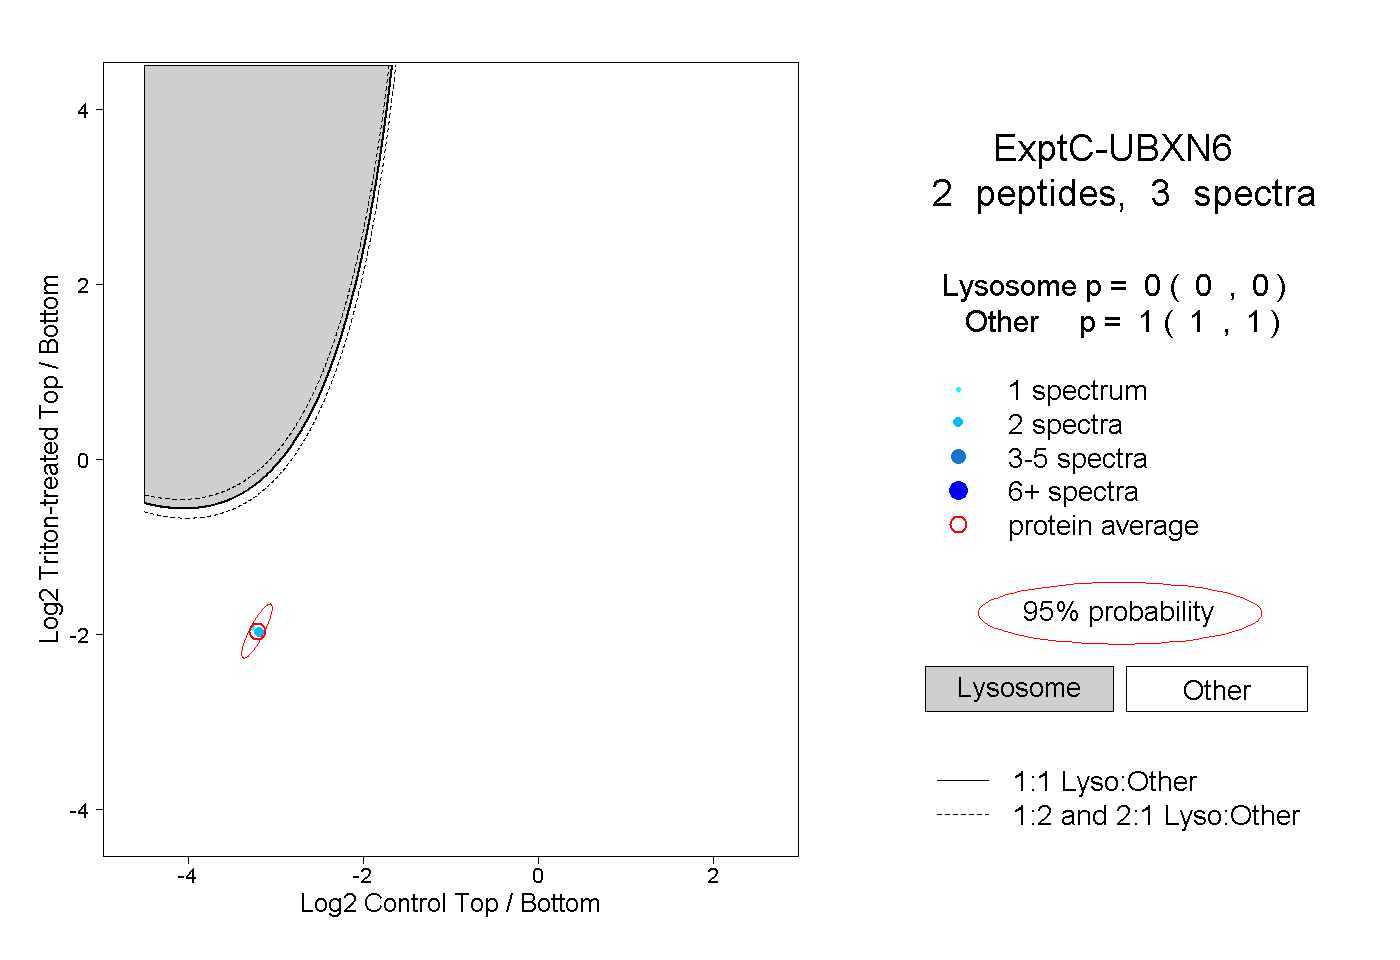 |
0.000 0.000 | 0.000 |
1.000 1.000 | 1.000 |